Fieldcode Manual

Tip: You can use filters for better results
Like the standard Timeline, the Timeline Beta provides a list of engineers and helps you plan and assign tickets to them.

The Timeline allows you to assign tickets to engineers, publish tickets to the engineer’s FMA app, and keep track of the assigned work for the engineers in Dispatch groups. The ticket colors provide you with valuable information regarding the state of a ticket (eg. if it has arrived in the engineer’s mobile app yet).

The Optimizer, a core function of the Work place, is also included in the Timeline and helps you quickly assign tickets to engineers in the best possible way with a simple click.

The Timeline component

Standard Timeline

  • Can dispay a maximum of 24 hours
  • Must move forwards or backwards a full day at a time, reloading with each click
  • Appointments and driving time is shown to within the nearest 5 minutes

Timeline Beta

  • Can display up to 48 hours
  • Can scroll indefinitely forwards or backwards without reloading
  • Has a more compact header section
  • Appointments and driving time are displayed accurately to the minute
  • Modern, sleek appearance

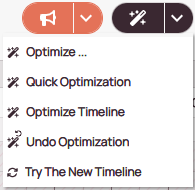
The Timeline Beta can be opening the dropdown menu for the Optimizer and selecting “Try the New Timeline”.

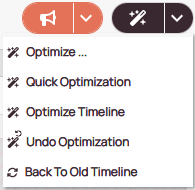
One may go back to the standard Timeline by opening the same menu and selecting “Back to Old Timeline”.

Access the Timeline Beta
Go back to the standard Timeline

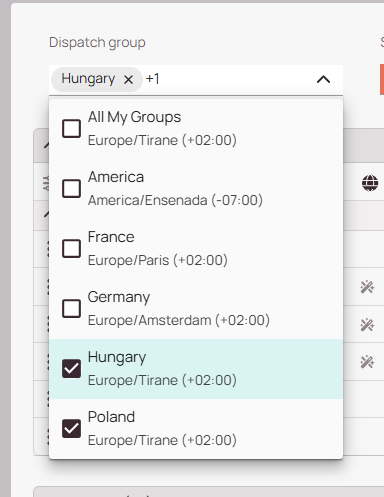
The Dispatch group drop-down allows you to select one or multiple dispatch groups. The Timeline updates to display all engineers assigned to the selected groups, allowing you to work with a single group or multiple groups at the same time.

The groups will have a small separation between them and the subgroups will also be displayed.  Each group will display in it’s set time zone.

Changing the dispatch group inside the Timeline

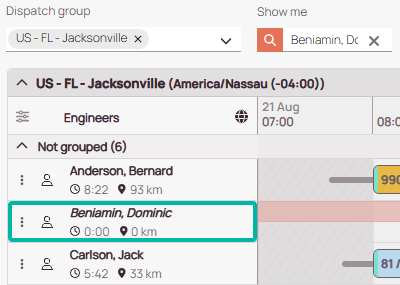
If you ever lose track of what’s happening in the Timeline, the Show Me feature can come in handy. Simply enter a CNE or engineer name, and the corresponding ticket(s) will be highlighted in green:

You can enter an CNI or engineer name in the "Show me" box to quickly highlight content in the Timeline

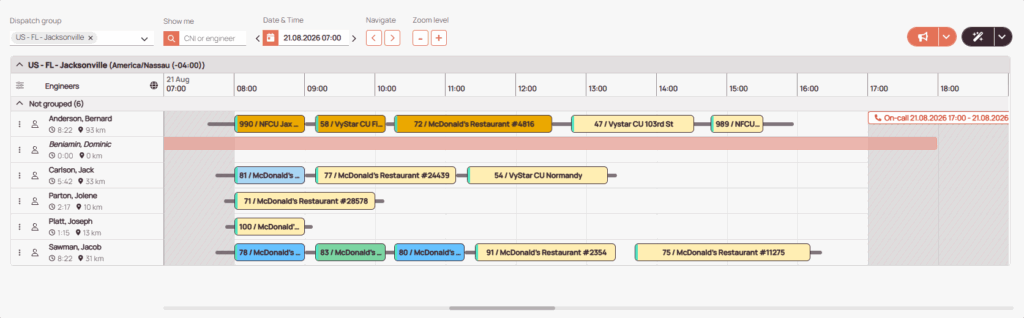
The calendar area in the Timeline shows the list of engineers, dispatch groups, dispatched tickets, information regarding absences and on-call duty, and estimated driving duration.

The Timeline filled with some tickets in different statuses

If an engineer who is absent will have the their absence marked on their Timeline in light red.  Text will display the duration of the absence.

Additional info, e.g. scheduled absences

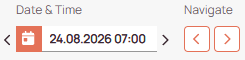
The calendar picker allows you to modify the view by selecting a different day. The Timeline will adjust information based on the selected day from the calendar.  and the calendar button gives you the flexibility to pick any date.

With the arrows, you can change the day. 

The calendar button displays data on the Timeline for the current calendar day.

If you click inside the date have the flexibility to pick any date, which is described below.
Click on image to expand/minimize

Clicking inside the Month/Year or clicking the downward arrow on the left gives you the option to select the year.

Clicking the left/right arrows changes the month.
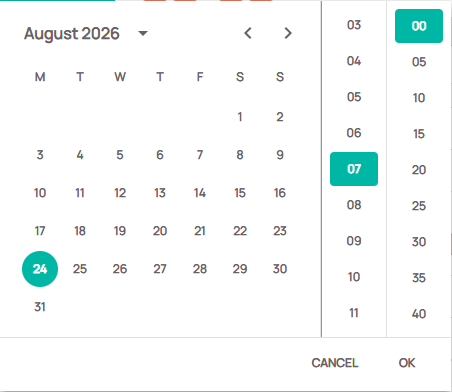
Click on image to expand/minimize

Zoom in and out to decide how much time to display, up to 48 hours.


Click on image to expand/minimize

You can also display an additional time zone and assign your engineers to different subgroups to add more clarity to your Timeline.

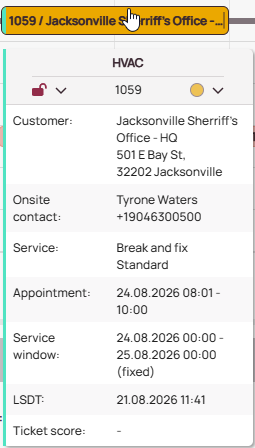
Hovering the mouse over certain parts of the Timeline will allow you to see more detailed information about the ticket:

Displaying the Ticket Details summary

You can customize which engineer data or ticket data is displayed in the Timeline by using the settings button. This way, you can customize your Timeline to your exact needs.

  1. Click on the Settings button in the Timeline to change Timeline Settings.
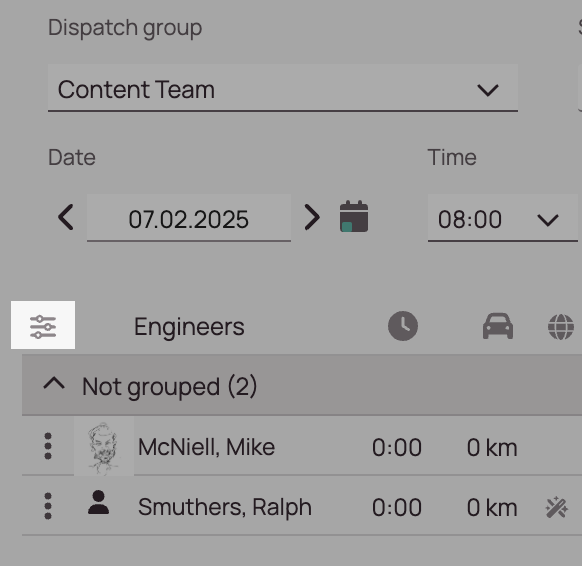
Click on image to expand/minimize
  1. In the Engineer data section, you can decide which engineer data should be displayed in the Timeline.
  2. (Optional) - Check or uncheck the Workload indicator. The Workload displays the current engineer workload in a pie chart.
  3. (Optional) - Check or uncheck the Avatar option. The Avatar is the picture one can set under Users.
  4. (Optional) - Check or uncheck the Work time indicator. The Work duration changes with tickets on the Timeline.
  5. (Optional) - Check or uncheck the Driving distance indicator. The driving distance changes with tickets on the Timeline.
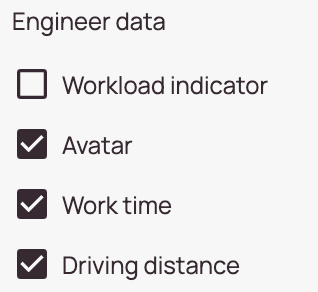
Click on image to expand/minimize
  1. In the Ticket data section, you can decide which ticket data should be displayed on tickets on the Timeline.
  2. (Optional) - Check or uncheck the CNI indicator.
  3. (Optional) - Check or uncheck the CNE indicator.
  4. (Optional) - Check or uncheck the ZIP indicator.
  5. (Optional) - Check or uncheck the City indicator.
  6. (Optional) - Check or uncheck the Company indicator.
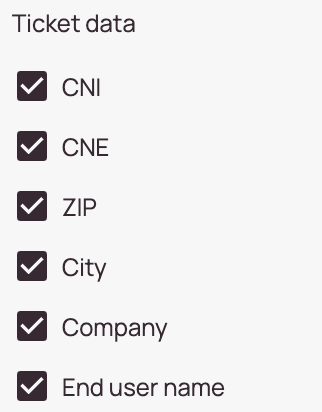
Click on image to expand/minimize

This is how ticket data is displayed on the Timeline with all the ticket data options checked. You could also uncheck all ticket data options to go for an ultra-minimalistic look (not recommended).

Click on image to expand/minimize

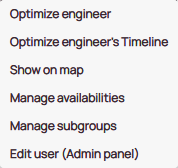
Clicking on the kepbab icon to the left of an engineer’s name or right-clicking on the engineer’s name will open the engineer context menu.

  • Optimize engineer – runs the optimizer for this engineer only
  • Optimize engineer’s Timeline – optimizes the unlocked and unpublished tickets that are already assigned to this engineers
  • Show on map – centers the map component on the engineer’s home
  • Manage availabilities – opens a pop-up menu where absences and on-call duty can be added to the Timeline
  • Manage subgroups – allows you to add or remove an engineer from a subgroup.
  • Edit user (Admin Panel) – will open the engineer’s user page in the Admin Panel on a new tab.  The option is only available to users with the appropriate persmissions to view and edit user information.

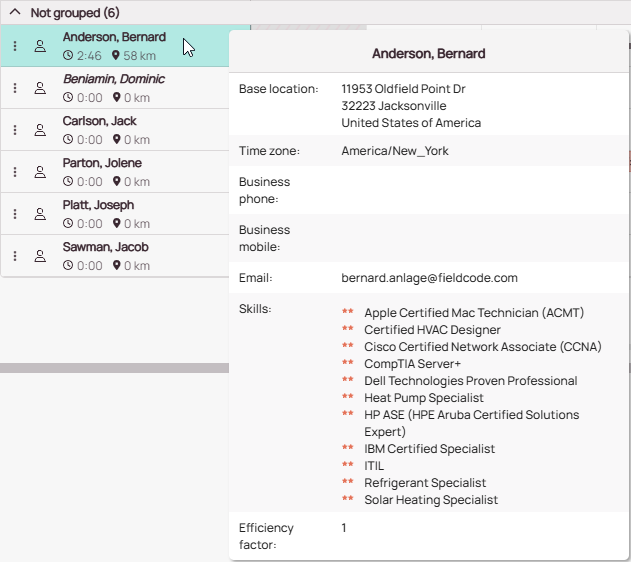
Hovering the mouse over an engineer reveals the engineer’s details:

Displaying the engineer summary

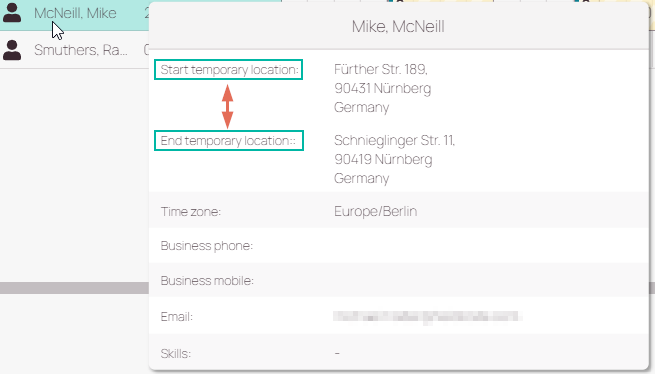
If particular engineers use temporary locations, you will also see them displayed conveniently in the engineer summary:

Temporary locations are also displayed (if used)

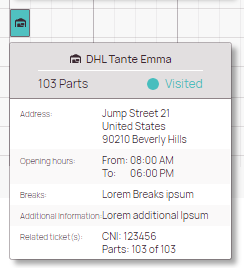
Hovering the mouse over a PUDO reveals important PUDO information:

Displaying the PUDO summary

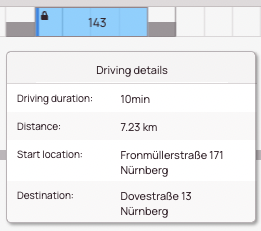
The driving details reveal when hovering over the gray bar before or after a ticket:

Driving summary

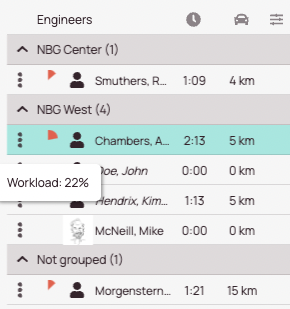
The workload indicator on the left side of an engineer shows how busy an engineer currently is in a practical pie chart:

Workload indicator
Was this topic helpful?
0 out of 5 stars
5 Stars 0%
4 Stars 0%
3 Stars 0%
2 Stars 0%
1 Stars 0%
5
How can we further improve this topic?
Please provide the reason for your vote. This will help us improve this topic.
Navigation