Tip: You can use filters for better results
-
Latest News
-
Getting Started
-
Work Place
-
-
-
- About Buttons
- Action Buttons
- Schedule Tickets
- Ticket Info and COMS Buttons
- Add Parts
- Assign Partners
- Remove Tickets from the Ticket Clipboard
- Inline Skill Editing
- Create Intervention Info
- Create Intervention Reports
- Cancel Tickets
- Cancel Appointments
- Clone Tickets
- Edit Ticket Details
- Edit Privat Notes
- Report Tickets
- Close Tickets
-
Admin Panel
-
FMA 2 App
-
Customer Portal
How to use the Optimizer Insights Report
What is the particular purpose of the Optimization Insights Report?
The Optimizer Insights Report gives you insights into your utilization improvements due to Optimizer usage.
The Optimizer Insights Report gives you an overview of your personal success story with the Optimizer.
The Report allows you to directly see how the Optimizer increased your utilization, how the Optimizer helped you to plan additional tickets, how drive times have shortened because of the Optimizer, how driving distances have shortened, and much more.
Who benefits most from the Optimization Insights Report?
These person groups can benefit most from the Optimization Insights Report: Managers.
Optimizations Summary tab
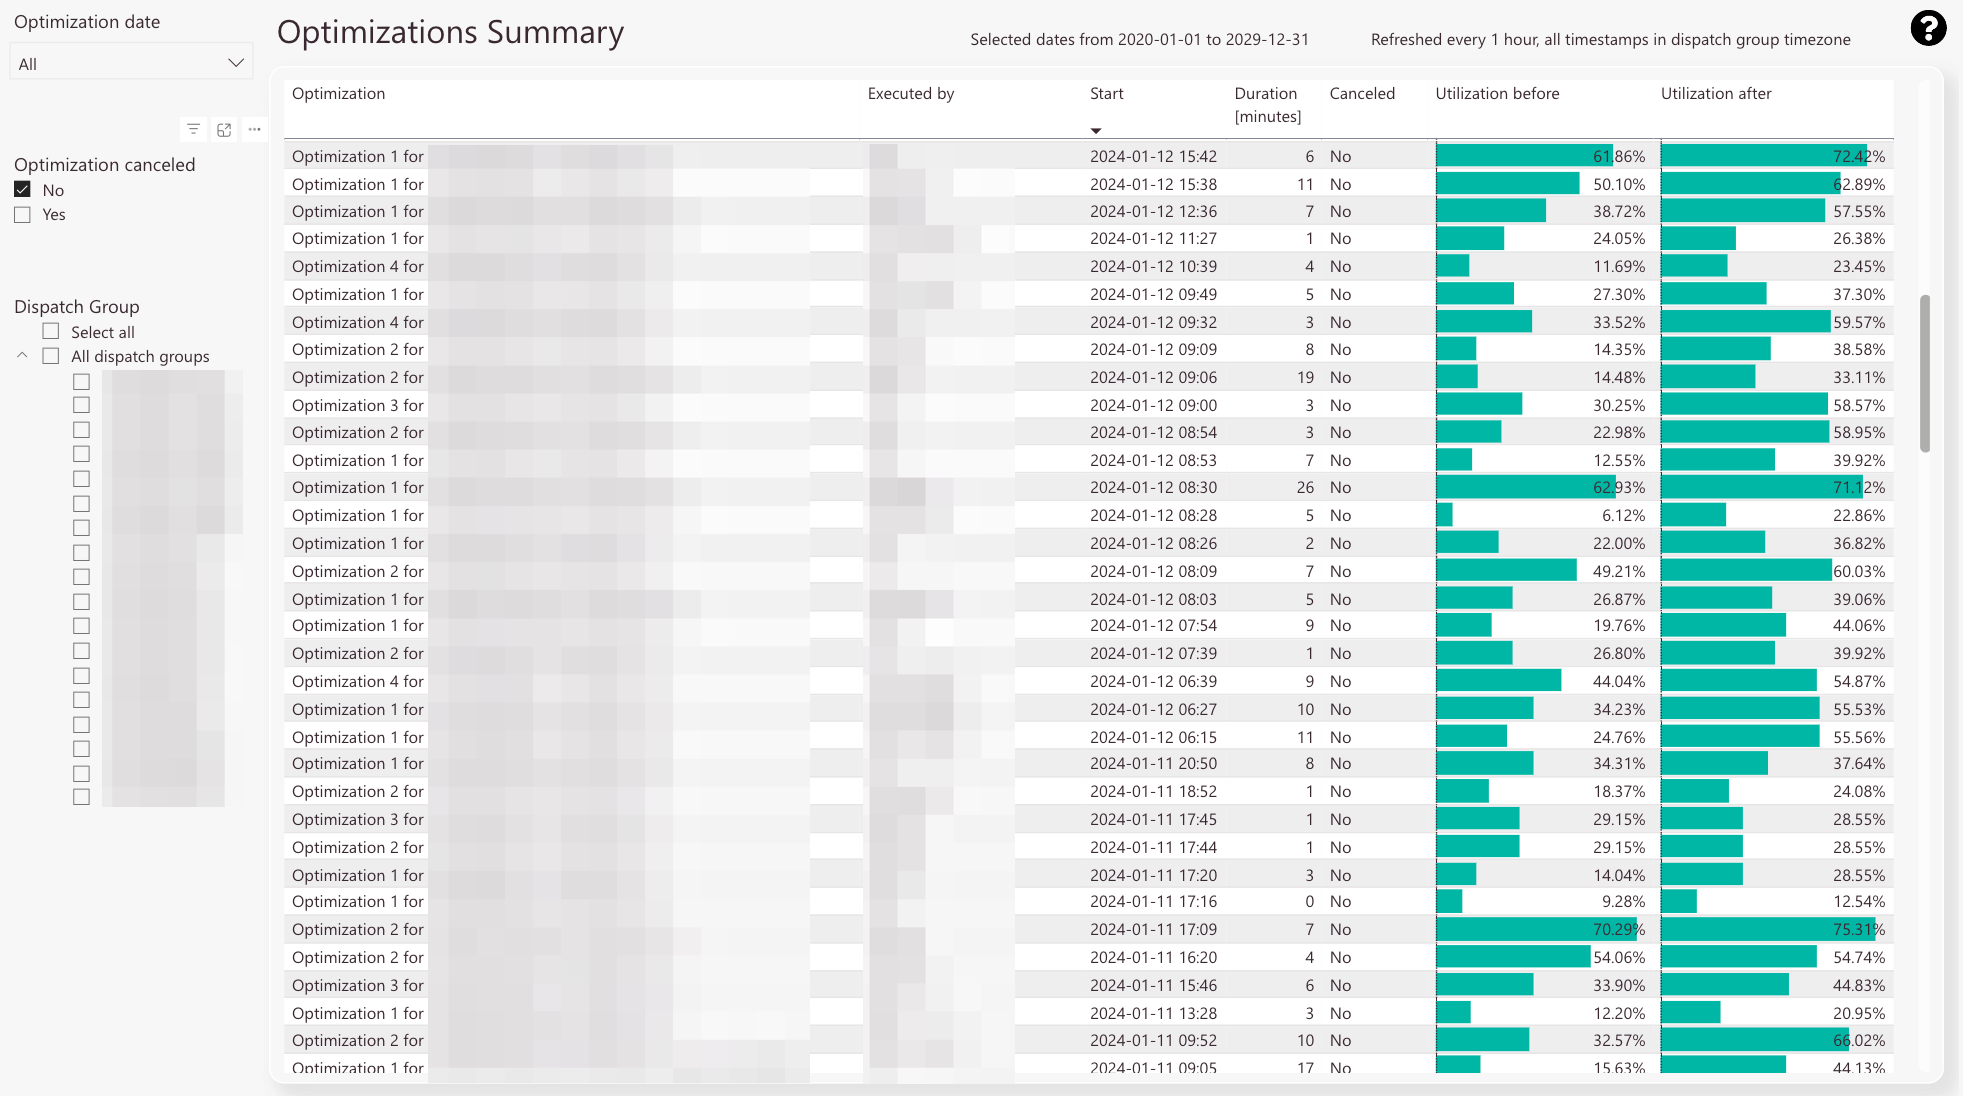
The Optimization summary presents you with general details about already-performed optimizations.
-
The Optimizations Summary lists all the performed optimizations for selected dispatch groups and provides a lot of details
-
In this column, you can check the optimization iterations for selected groups
-
In this column, you can check who (which user) executed the selected optimization
-
In this column, you can check at which date and time the selected optimization has been initiated
-
In this column, you can check how long the selected optimization ran
-
In this column, you can check if the selected optimization has been canceled
-
In this column, you can check the groups’ utilization before the optimization has been executed
-
In this column, you can check the groups’ utilization after the optimization has been executed
-
Optimization date filter
-
Optimization canceled filter
-
Dispatch Group filter
What is the particular purpose of this report?
To gain an overview of all performed optimizations.
What information can you get out of this particular report?
Optimization iteration, Optimization start, Who performed the optimization, When the Optimization began to run, How long the optimization took, if the optimization has been canceled, the Utilization before the Optimization, and the Utilization after the Optimization.
What does all the information stand for and how to read it?
The start is displayed with the date and time.
The duration is displayed in minutes.
The utilization before and after is displayed in percent.
Which related reports might be considered to get a clearer/more detailed picture of the information?
The optimization drill-through dashboards: Optimization Details and Optimization Details Per Engineer.
How can the report be customized using filters?
You can filter by optimization date.
You can filter by optimization canceled.
You can filter by dispatch group or dispatch groups.
You can combine all four filters.
Drill-through functionality inside the Optimization Insights
You can drill through individual optimizations inside the Optimization Insights.
The drill-through feature allows you to gain detailed insights for dispatch groups and individual engineers due to individual performed optimizations.
There are currently two different drill-through dashboards available:
- Optimization Details
- Optimization Details Per Engineer
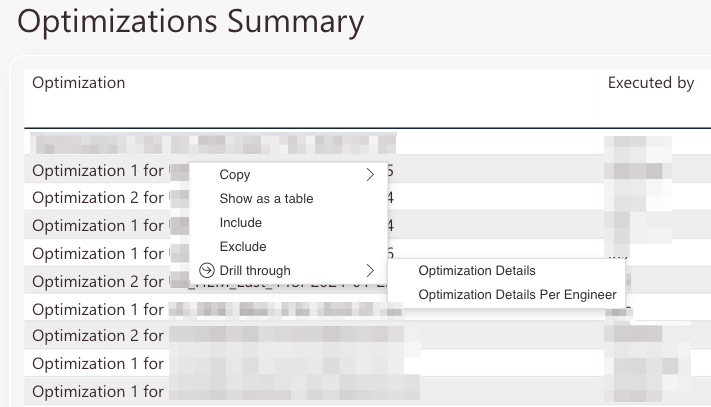
Here’s how to drill through a particular optimization from the above-mentioned dashboards:
- Right-click on an optimization.
- Click on Drill through.
- Select the dashboard that you want to analyze.
What is the Optimization Details Dashboard?
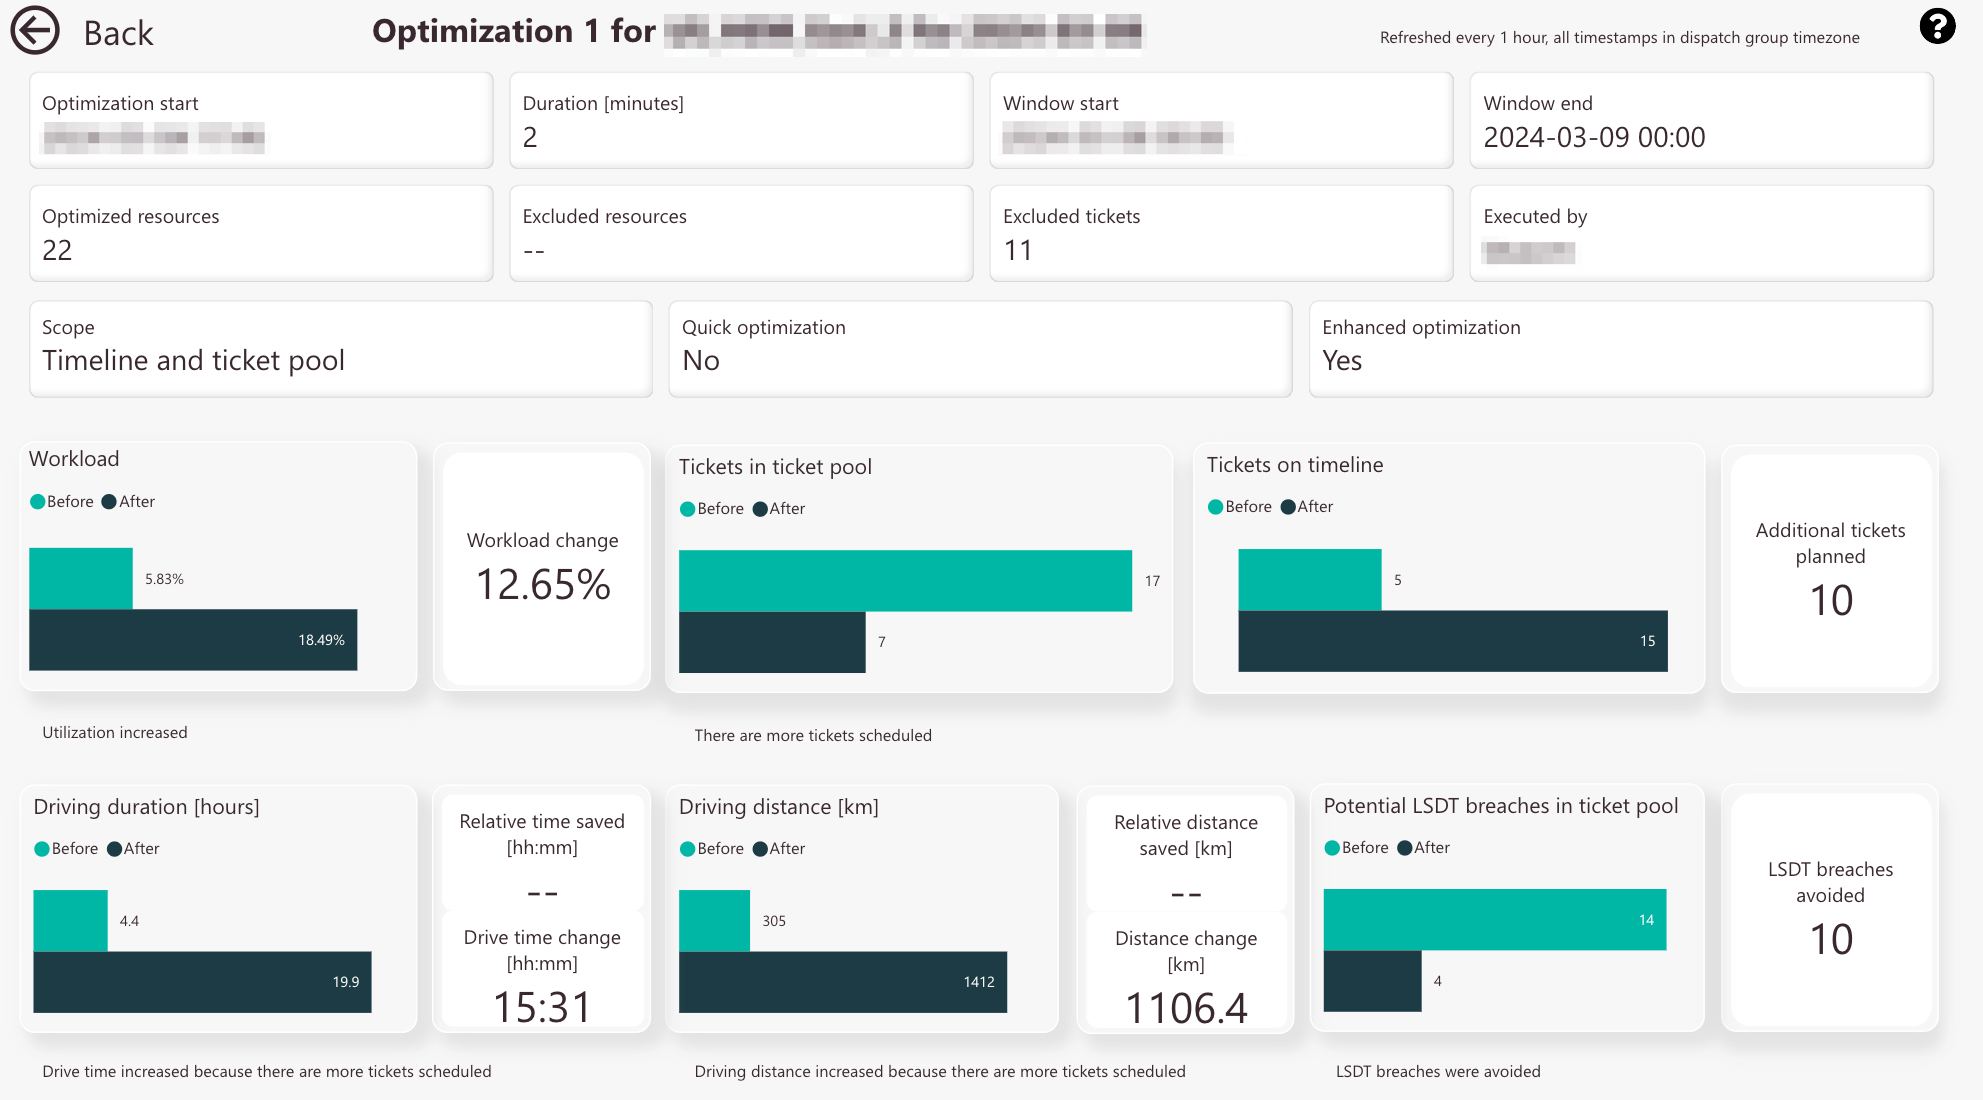
The Optimization Details presents you with rich-detailed information about a particular performed optimization.
-
Optimization start date and time
-
Optimization duration
-
Optimization window start date and time
-
Optimization window end date and time
-
Count of engineers that have been optimized
-
Count of engineers that have been excluded from the optimization
-
Count of tickets that have been excluded from the optimization
-
The user who performed this particular optimization
-
The optimization scope of this particular optimization
-
Displays you if the particular optimization has been a “quick optimization”
Learn more about the quick optimization -
Displays you if the particular optimization has been an “enhanced optimization”
Learn more about the enhanced optimization -
Timeline workload graphically compared before and after
A message under the block gives you a brief interpretation of the data -
Workload change in percent
-
Tickets in the Ticket Pool graphically compared before and after this particular optimization
A message under the block gives you a brief interpretation of the data -
Tickets in the Timeline graphically compared before and after this particular optimization
-
Additional tickets that have been planned during this particular optimization
-
Driving duration in hours graphically compared before and after optimization
A message under the block gives you a brief interpretation of the data -
Relative time saved because of this particular optimization
The relative time saved results from the comparison between the drive hours before and after optimization and gives you an idea of how much time has been saved due to this optimization run. These potential drive time savings could be used for other important business tasks. -
Drive time changes because of this particular optimization
A message under the block gives you a brief interpretation of the data -
Relative distance saved in kilometers because of this particular optimization
The relative distance saved results from the comparison between the drive distance before and after optimization and gives you an idea of how much distance has been saved due to this optimization run. These potential drive distance savings could be used for other important business tasks. -
Distance change in kilometers because of this particular optimization
A message under the block gives you a brief interpretation of the data -
LSDT breaches avoided due to this particular optimization
If this optimization run had not taken place, this number of tickets on the Ticket Pool would have exceeded the LSDT runtime
What is the Optimization Details Per Engineer Dashboard?
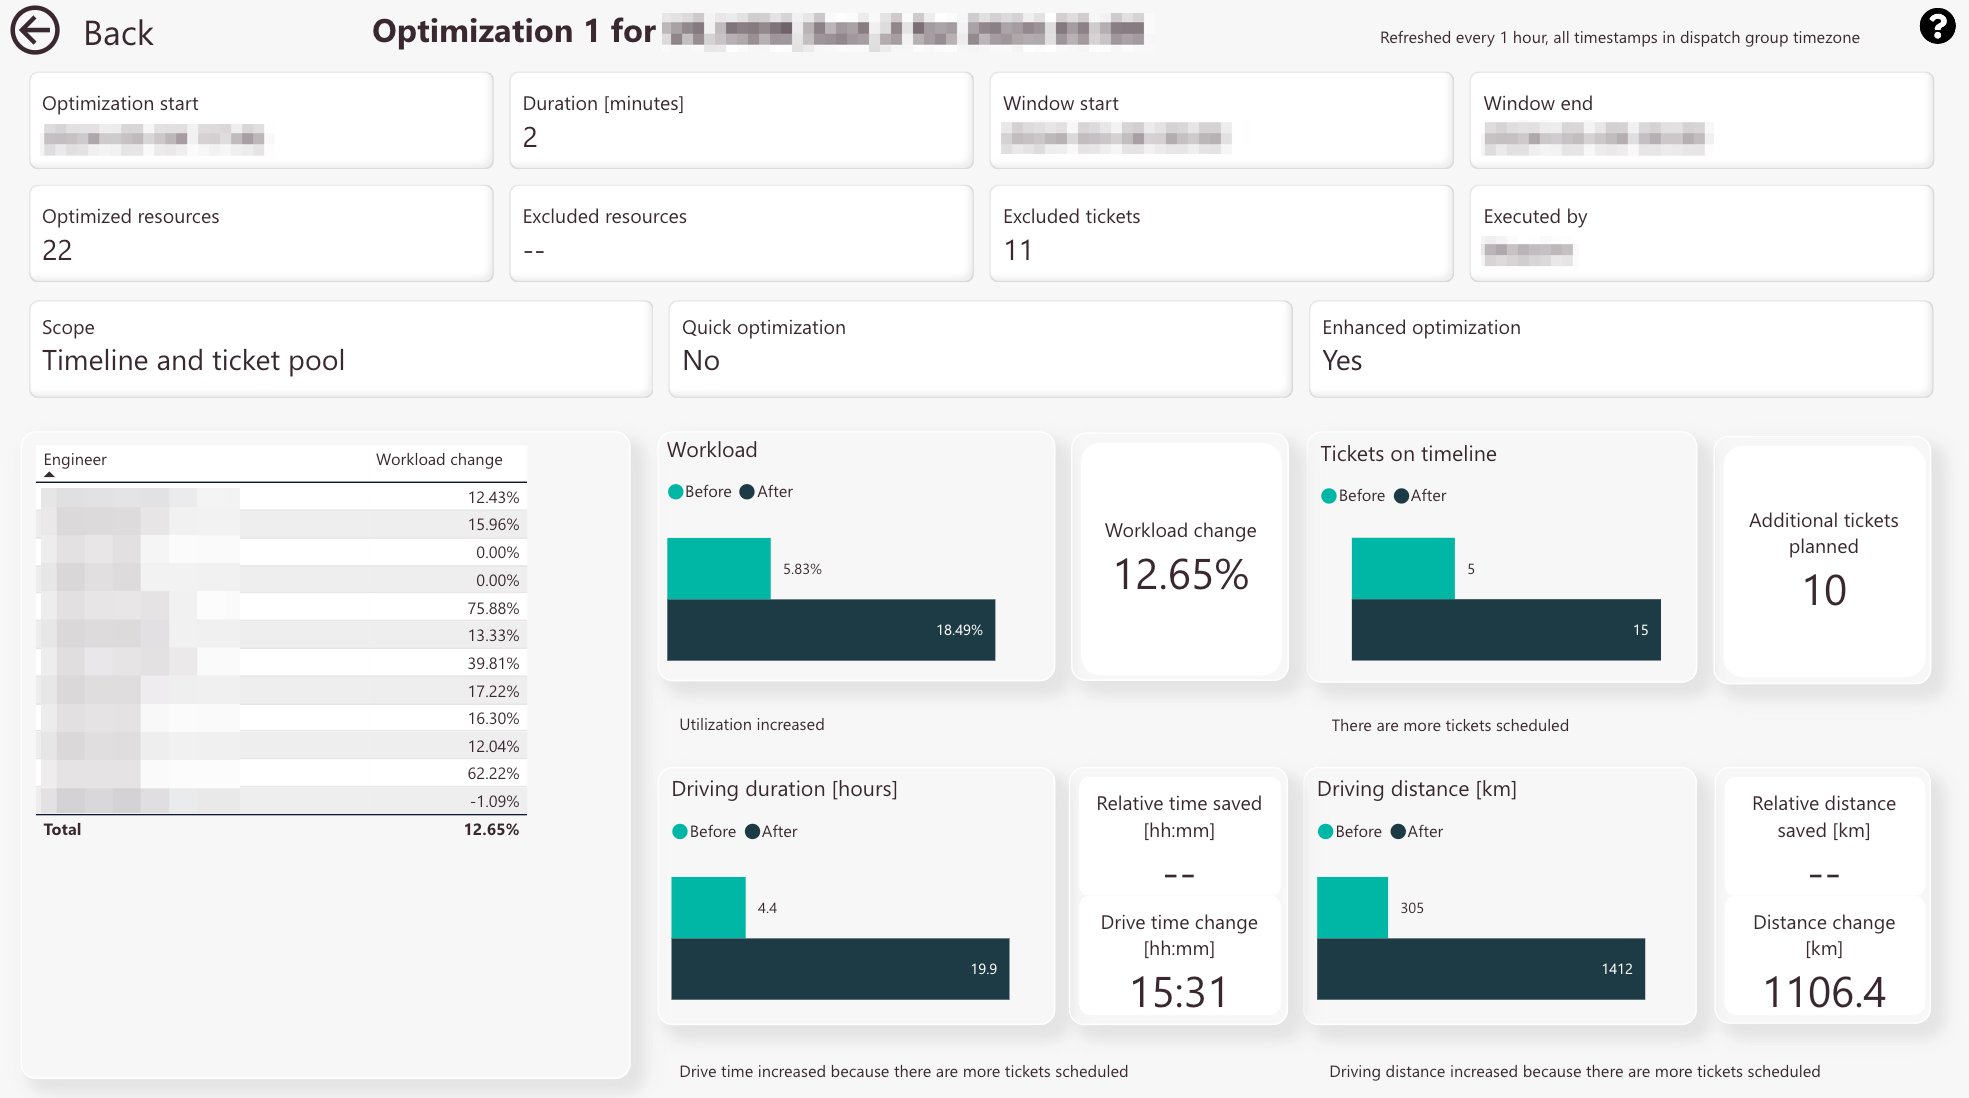
The Optimization Details Per Engineer presents rich detailed information about a particular performed optimization and focuses on engineers.
When you click nothing you will see the performance of the whole selected dispatch group cumulated together.
When you click on a particular engineer in block number 12, you will see only data from the currently selected engineer.
-
Optimization start date and time
-
Optimization duration
-
Optimization window start date and time
-
Optimization window end date and time
-
Count of engineers that have been optimized
-
Count of engineers that have been excluded from the optimization
-
Count of tickets that have been excluded from the optimization
-
The user who performed this particular optimization
-
The optimization scope of this particular optimization
-
If the particular optimization has been a “quick optimization”
Learn more about the quick optimization -
If the particular optimization has been an “enhanced optimization”
Learn more about the enhanced optimization -
Workload changes due to this particular optimization in percent for all from this individual optimization affected engineers
-
Timeline workload graphically compared before and after
A message under the block gives you a brief interpretation of the data -
Workload change in percent
Changes can be positive and negative -
Tickets in the Ticket Pool graphically compared before and after this particular optimization
A message under the block gives you a brief interpretation of the data -
Additional tickets that have been planned during this particular optimization
Tickets that have been in the Ticket Pool (Dispatch tab) before and were moved to the Timeline due to this optimization -
Driving duration in hours graphically compared before and after optimization
A message under the block gives you a brief interpretation of the data -
Relative time saved because of this particular optimization
-
Drive time changes because of this particular optimization
A message under the block gives you a brief interpretation of the data -
LSDT breaches avoided due to this particular optimization
If this optimization run had not taken place, this number of tickets would have exceeded the LSDT runtime
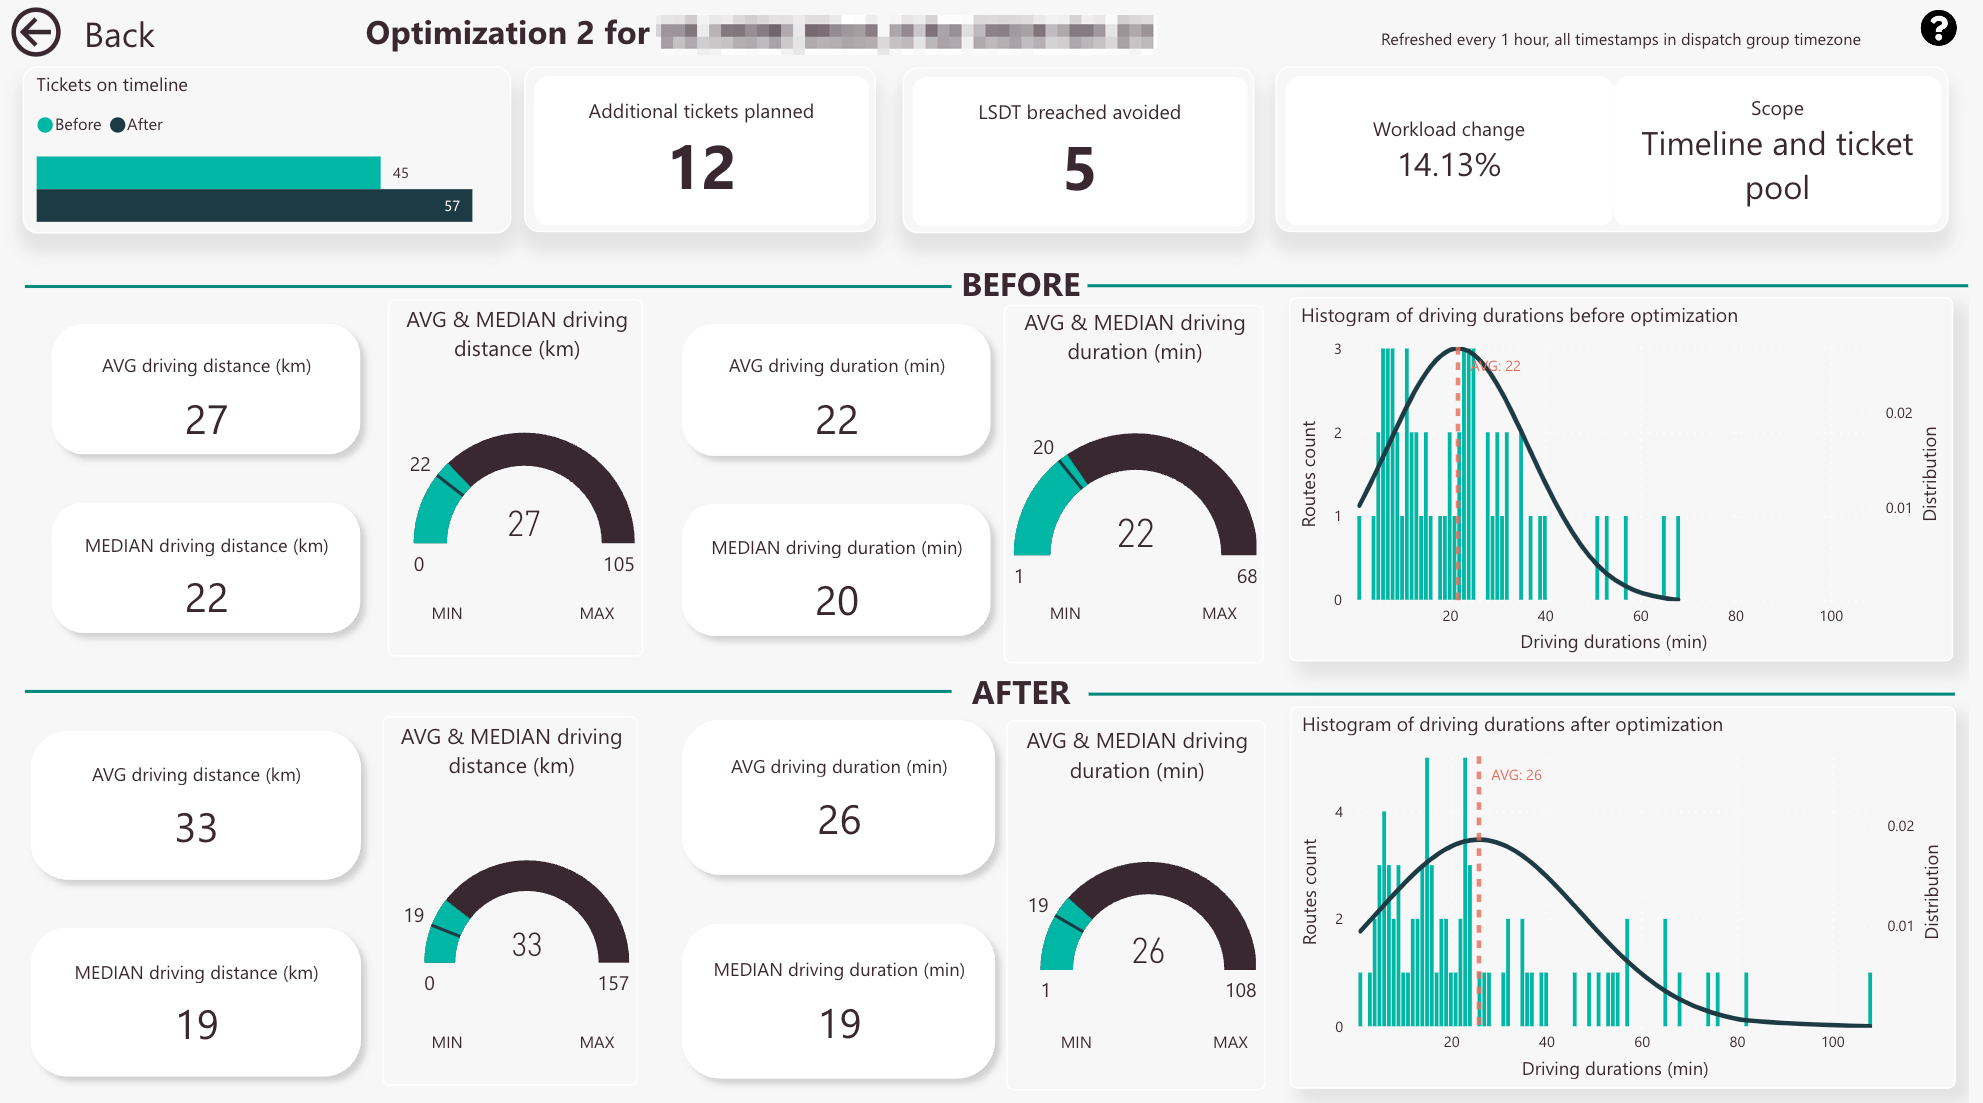
What is the Driving Details Dashboard?
The Driving Details Dashboard presents rich detailed information about a particular performed optimization and focuses on driving stats.
-
Tickets on Timeline before and after this particular optimization
-
Additional tickets planned due to this particular optimization
-
LSDT breaches avoided due to this particular optimization
-
Workload change in percent due to this particular optimization
-
Optimization scope of this particular optimization
-
Average driving distance in kilometers before this particular optimization. The average adds up all values and divides the sum by the total number of values.
-
Average driving duration in minutes before this particular optimization. The average adds up all values and divides the sum by the total number of values.
-
Median driving distance in kilometers before this particular optimization. The median lists the numbers in order and finds the number in the middle.
-
Average and median driving distance in kilometers before optimization displayed in a gauge view
-
Median driving duration in minutes before this particular optimization. The median lists the numbers in order and finds the number in the middle.
-
Average and median driving duration in minutes before optimization displayed in a gauge view
-
Histogram of driving durations before optimization
-
Average driving distance in kilometers after this particular optimization. The average adds up all values and divides the sum by the total number of values.
-
Average driving duration in minutes after this particular optimization. The average adds up all values and divides the sum by the total number of values.
-
Median driving distance in kilometers after this particular optimization. The median lists the numbers in order and finds the number in the middle.
-
Average and median driving distance in kilometers after optimization displayed in a gauge view
-
Median driving duration in minutes after this particular optimization. The median lists the numbers in order and finds the number in the middle.
-
Average and median driving duration in minutes after optimization displayed in a gauge view
-
Histogram of driving durations after optimization
5 out of 5 stars
1 rating
| 5 Stars | 100% | |
| 4 Stars | 0% | |
| 3 Stars | 0% | |
| 2 Stars | 0% | |
| 1 Stars | 0% |
