Tip: You can use filters for better results
-
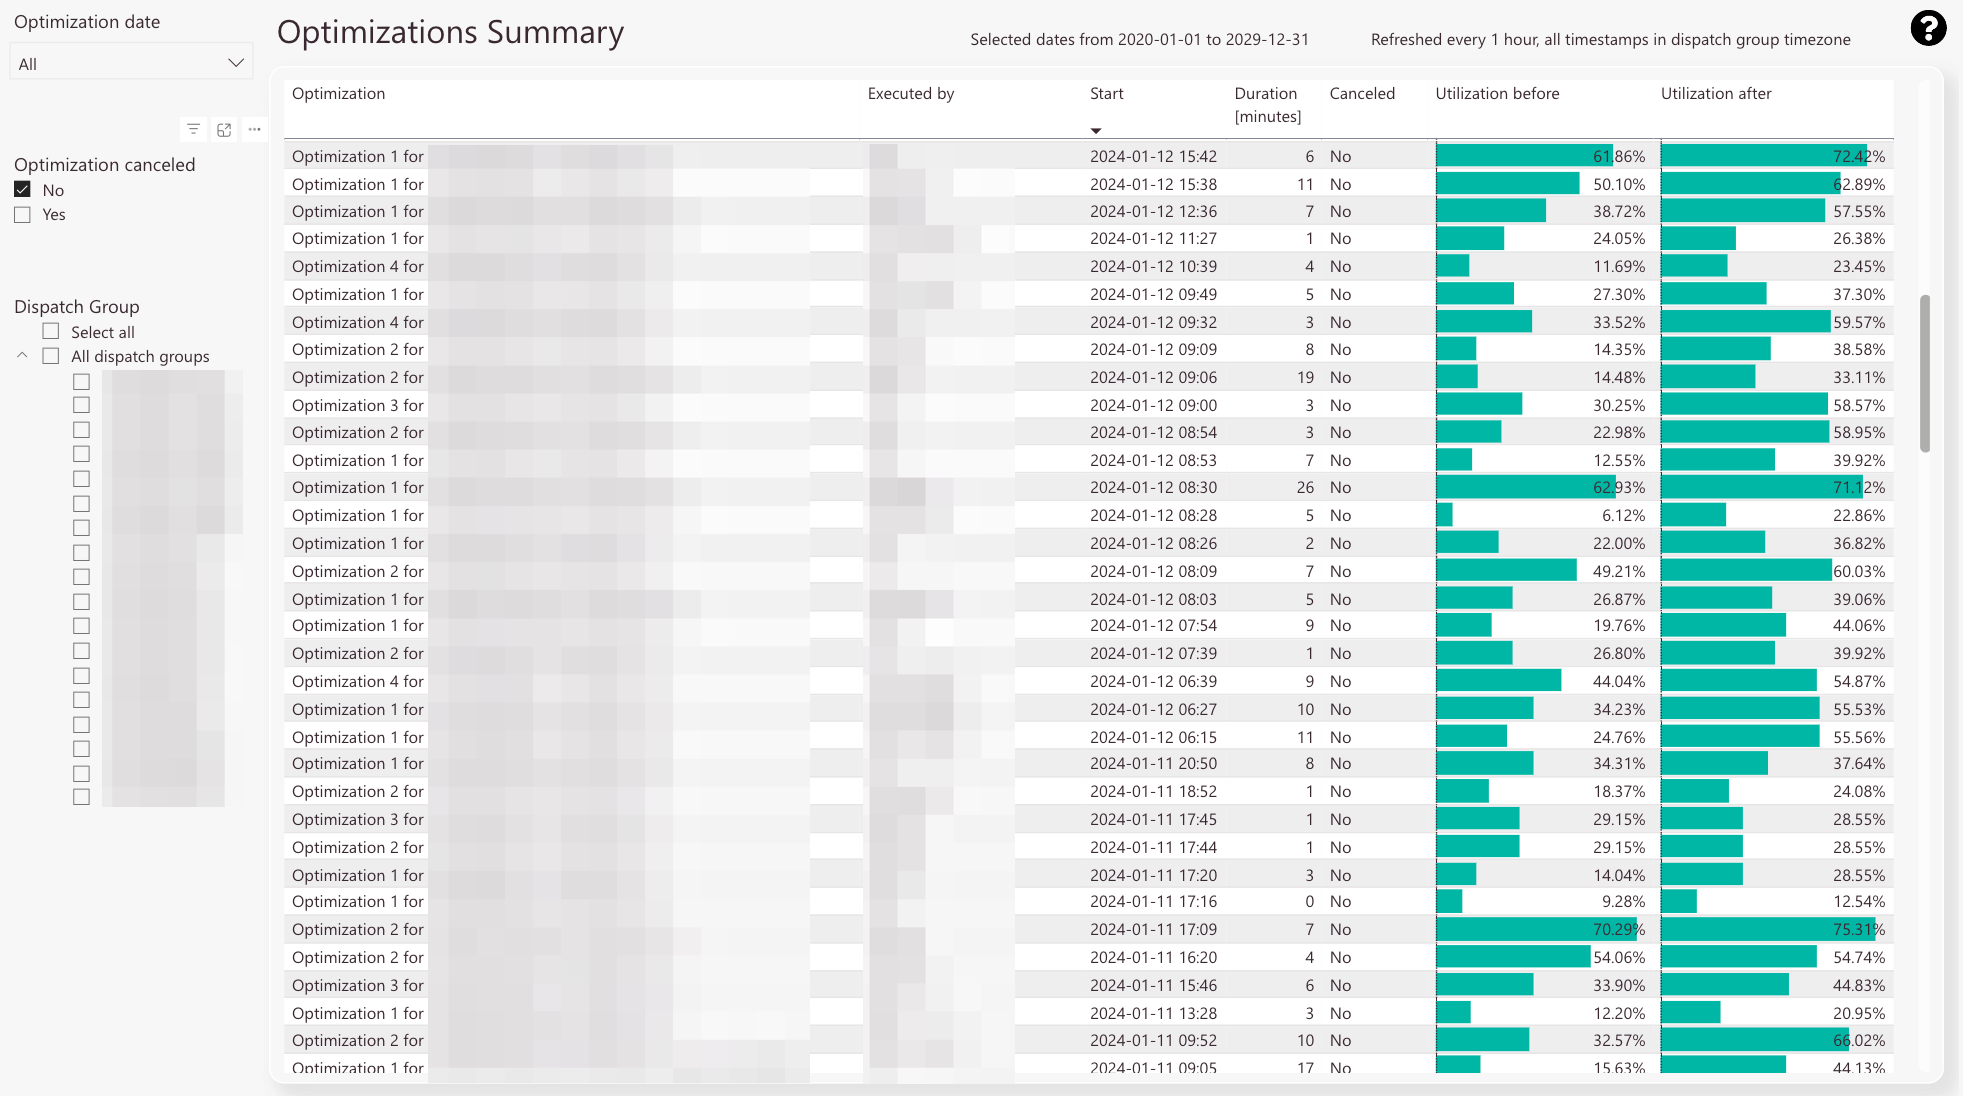
The Optimizations Summary lists all the performed optimizations for selected dispatch groups and provides a lot of details
-
In this column, you can check the optimization iterations for selected groups
-
In this column, you can check who (which user) executed the selected optimization
-
In this column, you can check at which date and time the selected optimization has been initiated
-
In this column, you can check how long the selected optimization ran
-
In this column, you can check if the selected optimization has been canceled
-
In this column, you can check the groups’ utilization before the optimization has been executed
-
In this column, you can check the groups’ utilization after the optimization has been executed
-
Optimization date filter
-
Optimization canceled filter
-
Dispatch Group filter
-
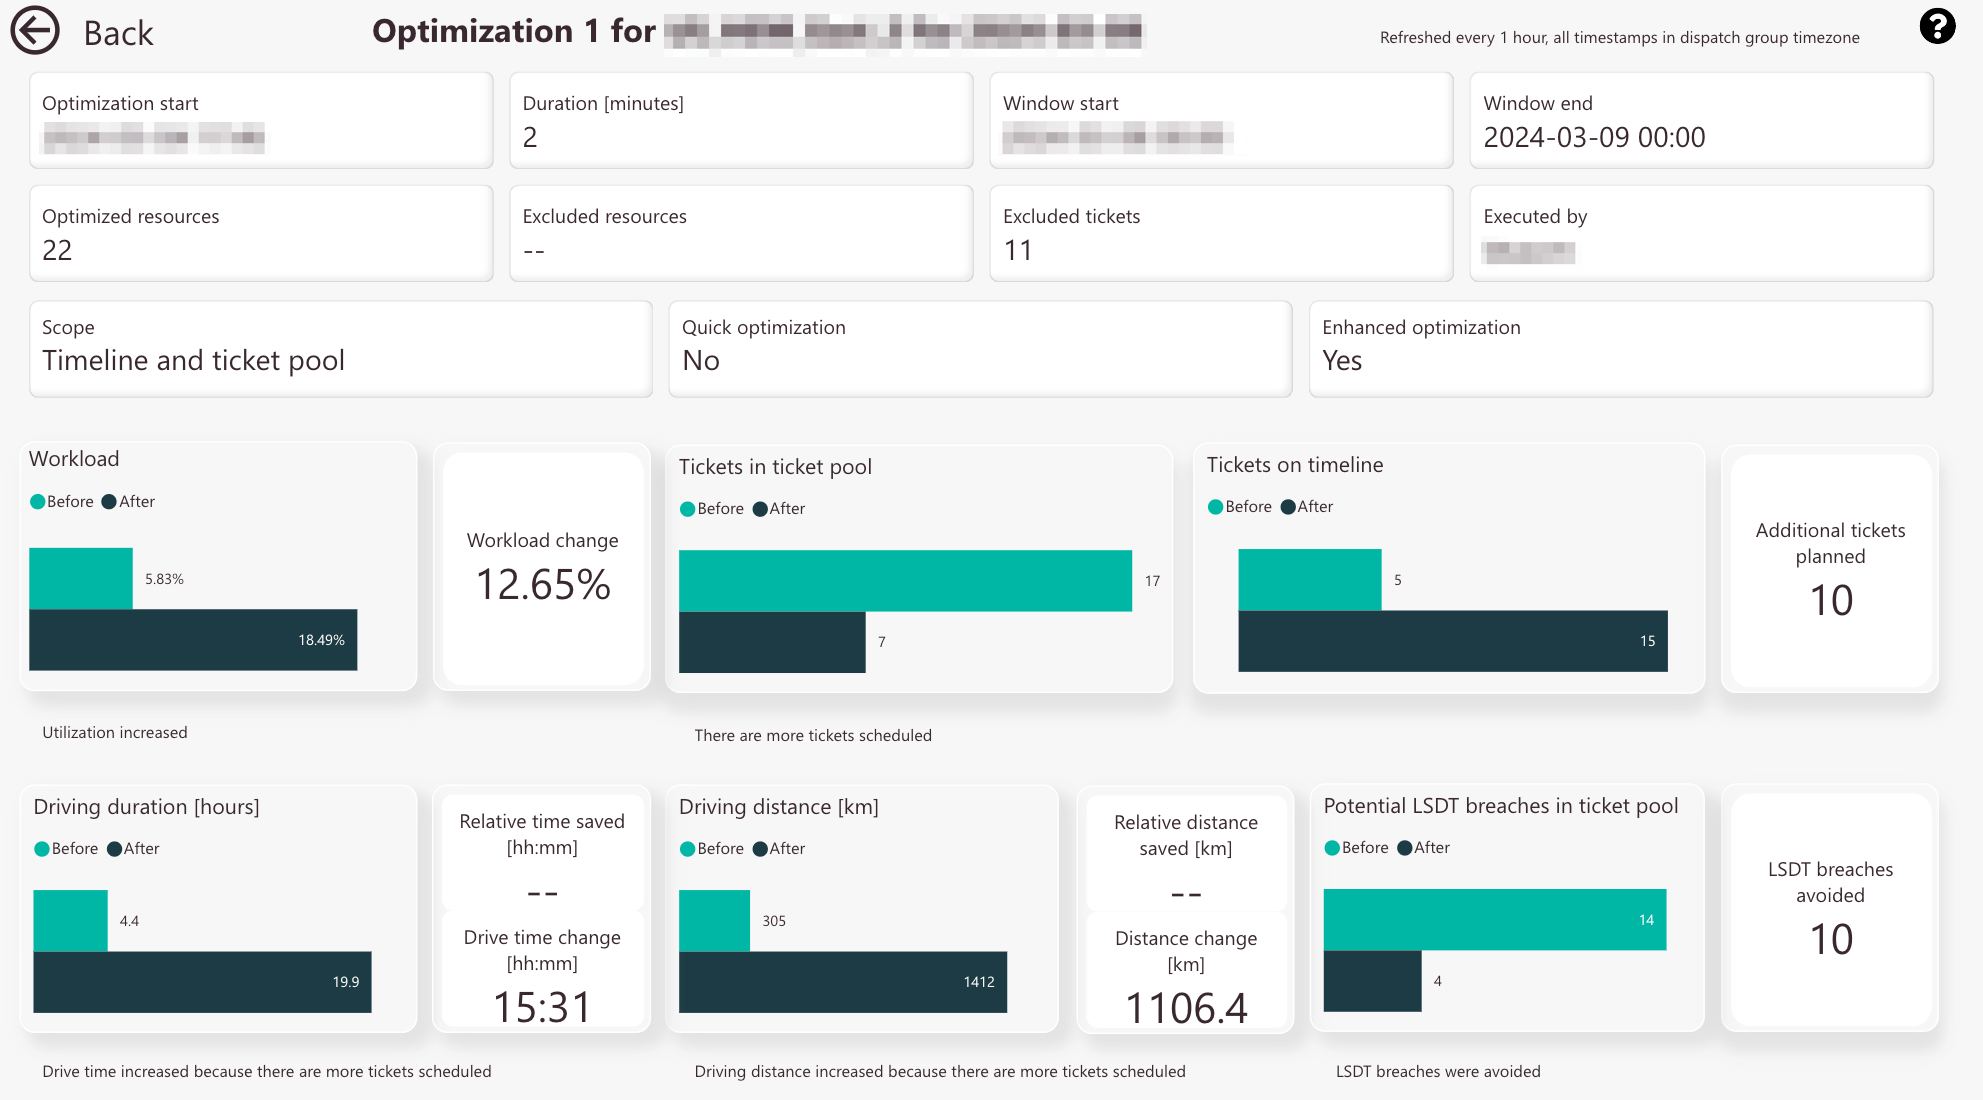
Optimization start date and time
-
Optimization duration
-
Optimization window start date and time
-
Optimization window end date and time
-
Count of engineers that have been optimized
-
Count of engineers that have been excluded from the optimization
-
Count of tickets that have been excluded from the optimization
-
The user who performed this particular optimization
-
The optimization scope of this particular optimization
-
Displays you if the particular optimization has been a “quick optimization”
Learn more about the quick optimization -
Displays you if the particular optimization has been an “enhanced optimization”
Learn more about the enhanced optimization -
Timeline workload graphically compared before and after
A message under the block gives you a brief interpretation of the data -
Workload change in percent
-
Tickets in the Ticket Pool graphically compared before and after this particular optimization
A message under the block gives you a brief interpretation of the data -
Tickets in the Timeline graphically compared before and after this particular optimization
-
Additional tickets that have been planned during this particular optimization
-
Driving duration in hours graphically compared before and after optimization
A message under the block gives you a brief interpretation of the data -
Relative time saved because of this particular optimization
The relative time saved results from the comparison between the drive hours before and after optimization and gives you an idea of how much time has been saved due to this optimization run. These potential drive time savings could be used for other important business tasks. -
Drive time changes because of this particular optimization
A message under the block gives you a brief interpretation of the data -
Relative distance saved in kilometers because of this particular optimization
The relative distance saved results from the comparison between the drive distance before and after optimization and gives you an idea of how much distance has been saved due to this optimization run. These potential drive distance savings could be used for other important business tasks. -
Distance change in kilometers because of this particular optimization
A message under the block gives you a brief interpretation of the data -
LSDT breaches avoided due to this particular optimization
If this optimization run had not taken place, this number of tickets on the Ticket Pool would have exceeded the LSDT runtime
-
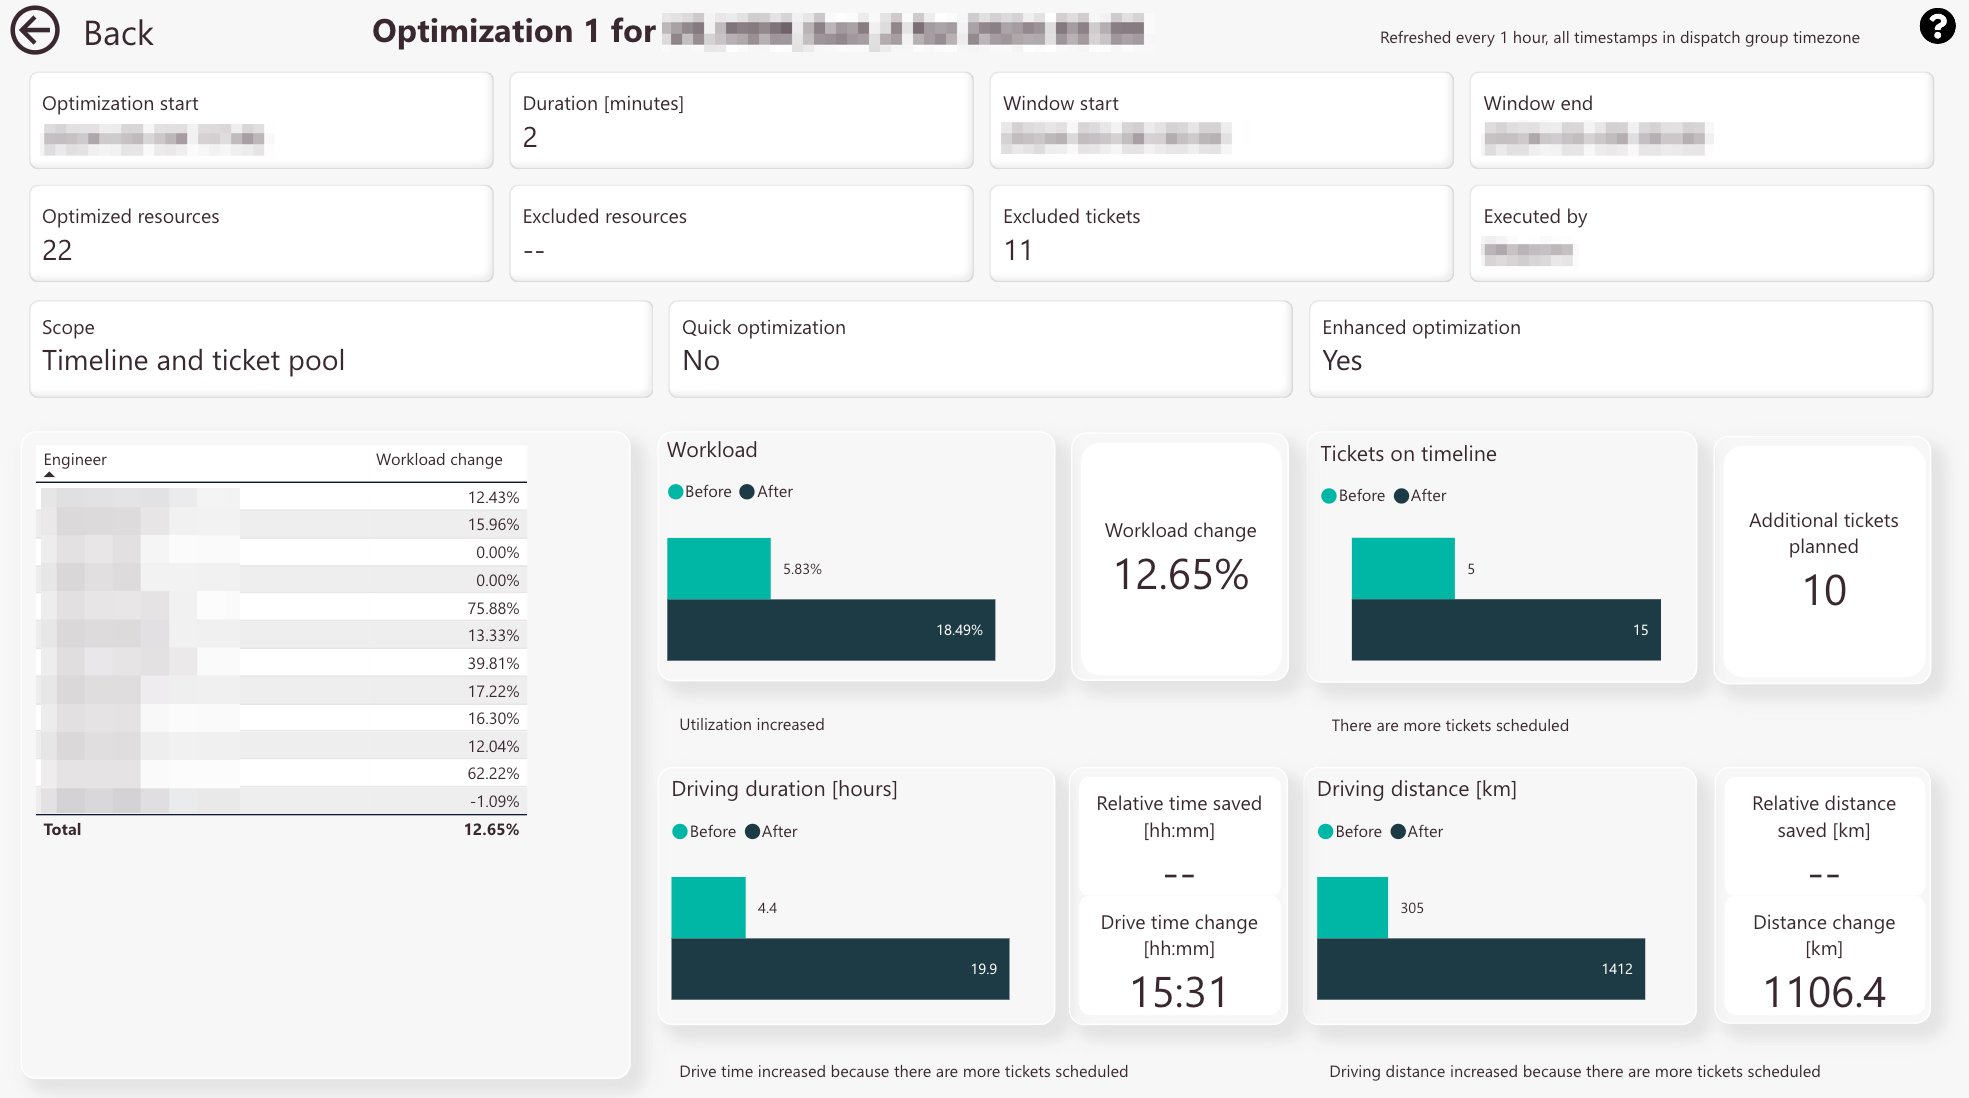
Optimization start date and time
-
Optimization duration
-
Optimization window start date and time
-
Optimization window end date and time
-
Count of engineers that have been optimized
-
Count of engineers that have been excluded from the optimization
-
Count of tickets that have been excluded from the optimization
-
The user who performed this particular optimization
-
The optimization scope of this particular optimization
-
If the particular optimization has been a “quick optimization”
Learn more about the quick optimization -
If the particular optimization has been an “enhanced optimization”
Learn more about the enhanced optimization -
Workload changes due to this particular optimization in percent for all from this individual optimization affected engineers
-
Timeline workload graphically compared before and after
A message under the block gives you a brief interpretation of the data -
Workload change in percent
Changes can be positive and negative -
Tickets in the Ticket Pool graphically compared before and after this particular optimization
A message under the block gives you a brief interpretation of the data -
Additional tickets that have been planned during this particular optimization
Tickets that have been in the Ticket Pool (Dispatch tab) before and were moved to the Timeline due to this optimization -
Driving duration in hours graphically compared before and after optimization
A message under the block gives you a brief interpretation of the data -
Relative time saved because of this particular optimization
-
Drive time changes because of this particular optimization
A message under the block gives you a brief interpretation of the data -
LSDT breaches avoided due to this particular optimization
If this optimization run had not taken place, this number of tickets would have exceeded the LSDT runtime
-
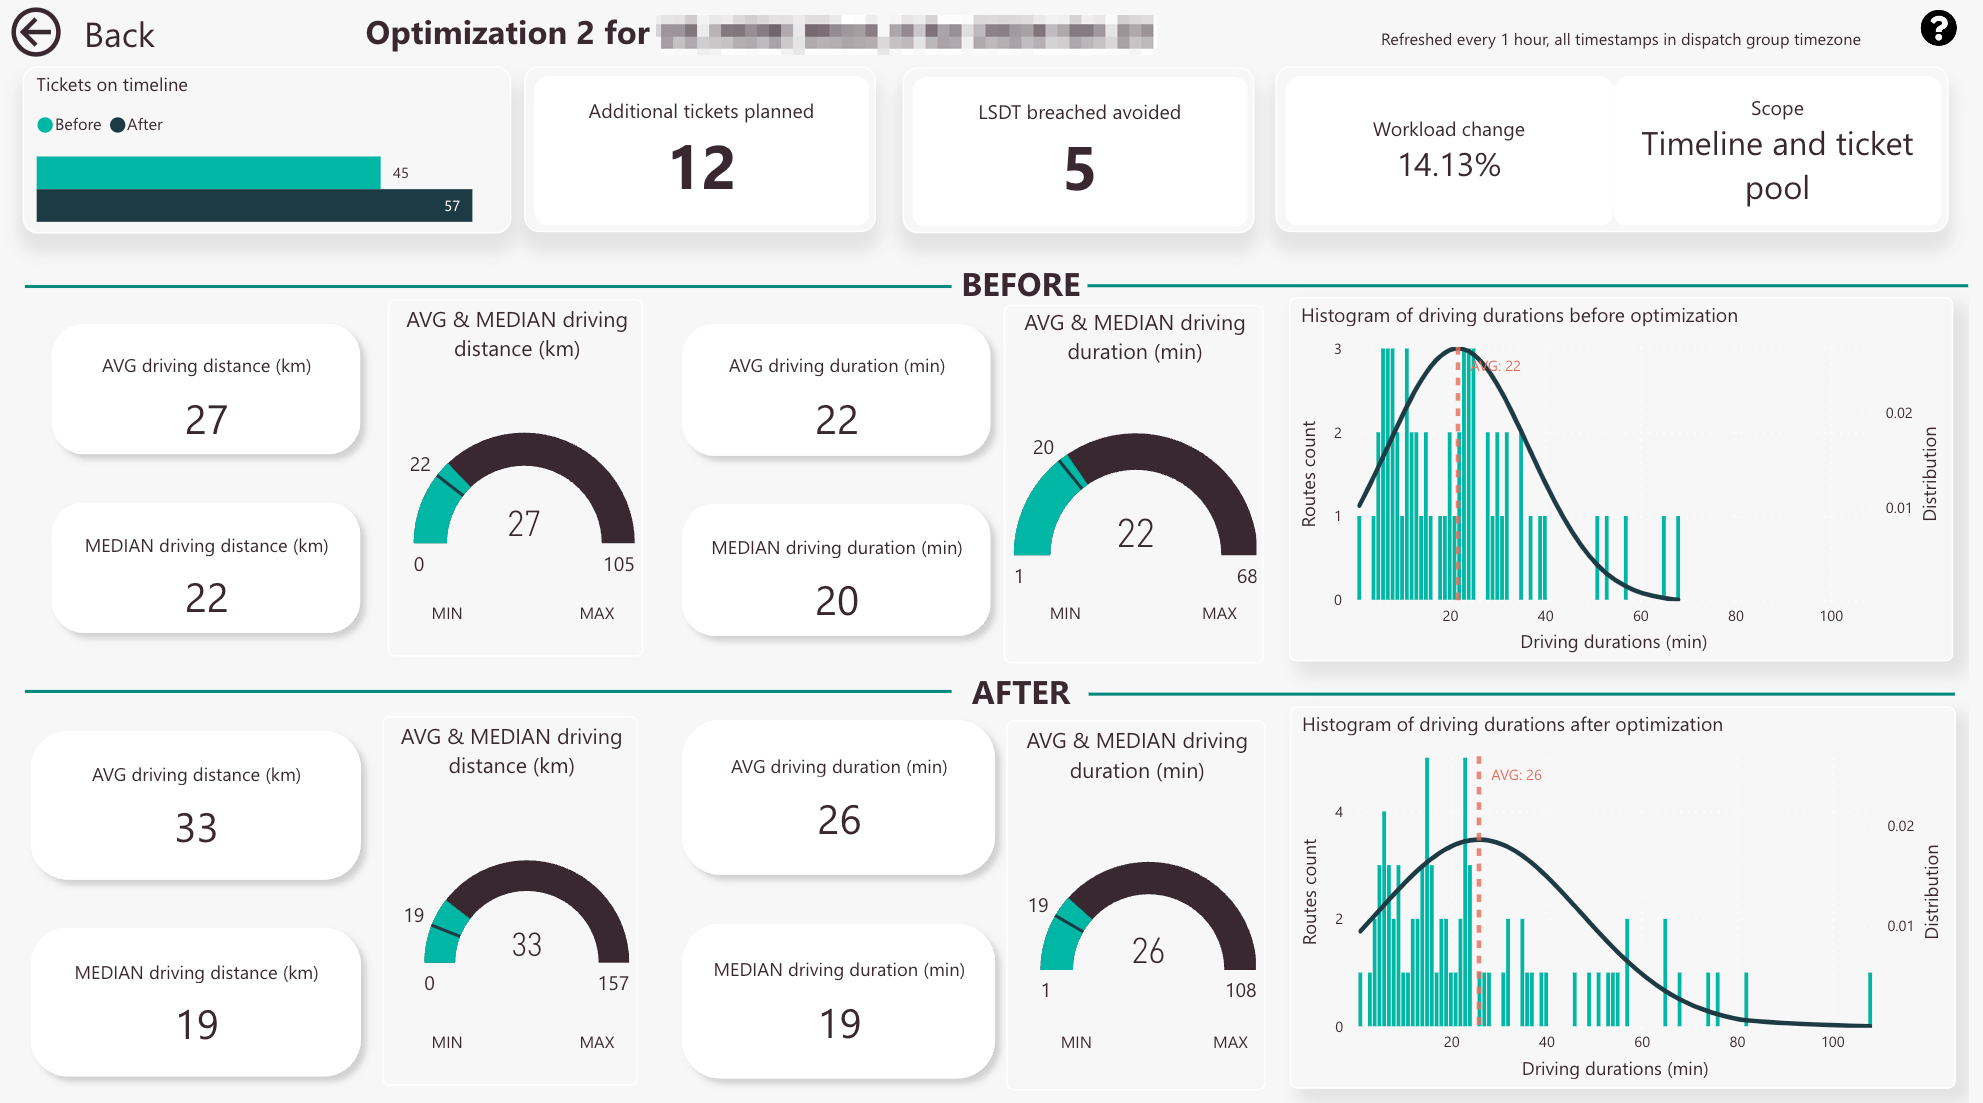
Tickets on Timeline before and after this particular optimization
-
Additional tickets planned due to this particular optimization
-
LSDT breaches avoided due to this particular optimization
-
Workload change in percent due to this particular optimization
-
Optimization scope of this particular optimization
-
Average driving distance in kilometers before this particular optimization. The average adds up all values and divides the sum by the total number of values.
-
Average driving duration in minutes before this particular optimization. The average adds up all values and divides the sum by the total number of values.
-
Median driving distance in kilometers before this particular optimization. The median lists the numbers in order and finds the number in the middle.
-
Average and median driving distance in kilometers before optimization displayed in a gauge view
-
Median driving duration in minutes before this particular optimization. The median lists the numbers in order and finds the number in the middle.
-
Average and median driving duration in minutes before optimization displayed in a gauge view
-
Histogram of driving durations before optimization
-
Average driving distance in kilometers after this particular optimization. The average adds up all values and divides the sum by the total number of values.
-
Average driving duration in minutes after this particular optimization. The average adds up all values and divides the sum by the total number of values.
-
Median driving distance in kilometers after this particular optimization. The median lists the numbers in order and finds the number in the middle.
-
Average and median driving distance in kilometers after optimization displayed in a gauge view
-
Median driving duration in minutes after this particular optimization. The median lists the numbers in order and finds the number in the middle.
-
Average and median driving duration in minutes after optimization displayed in a gauge view
-
Histogram of driving durations after optimization