Fieldcode Manual

Tip: You can use filters for better results

What is the particular purpose of the Dispatch Insights Report?
The Dispatch Insights Report gives you insights about reassigned tickets, potential delays with your tickets, and about rescheduled tickets.

Who benefits most from the Dispatch Insights Report?
These person groups can benefit most from the Dispatch Insights Report: Managers and Dispatchers.

The Assigned to partners tab displays all tickets and splits the ticket amount into partner-assigned tickets and normal tickets.
The ratio between partner-assigned tickets and normal tickets is also displayed in per cent for every selected month.

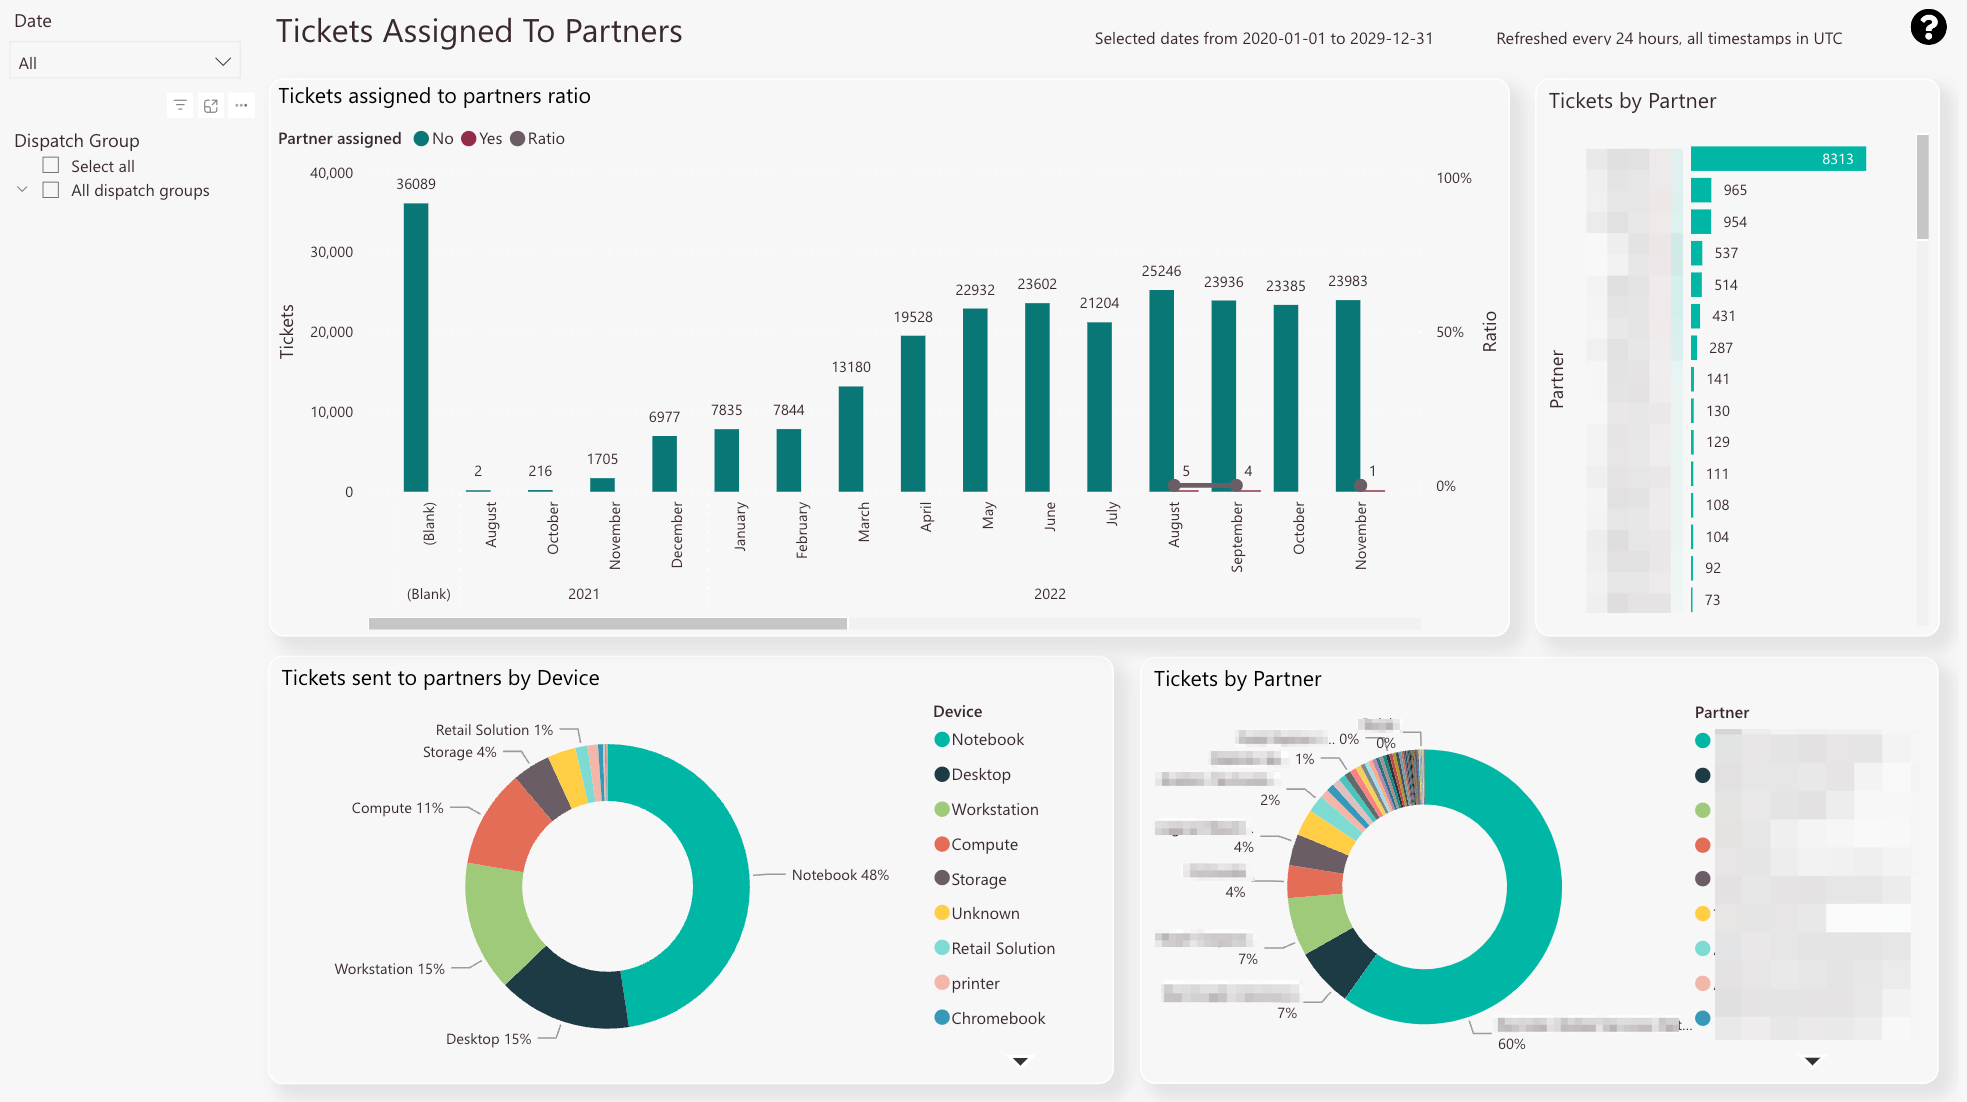
  • The red bar displays the ticket amount that has not been sent over to partners.
    The green bar displays the ticket amount that has been sent over to partners.
    The ratio between partner-assigned tickets and normal tickets is displayed as a line (for trends) and in percent.

  • Ticket amount per partner

  • Selected tickets that were sent to partners and how they split up by device type

  • Selected tickets that were sent to partners and how they split up by partner company
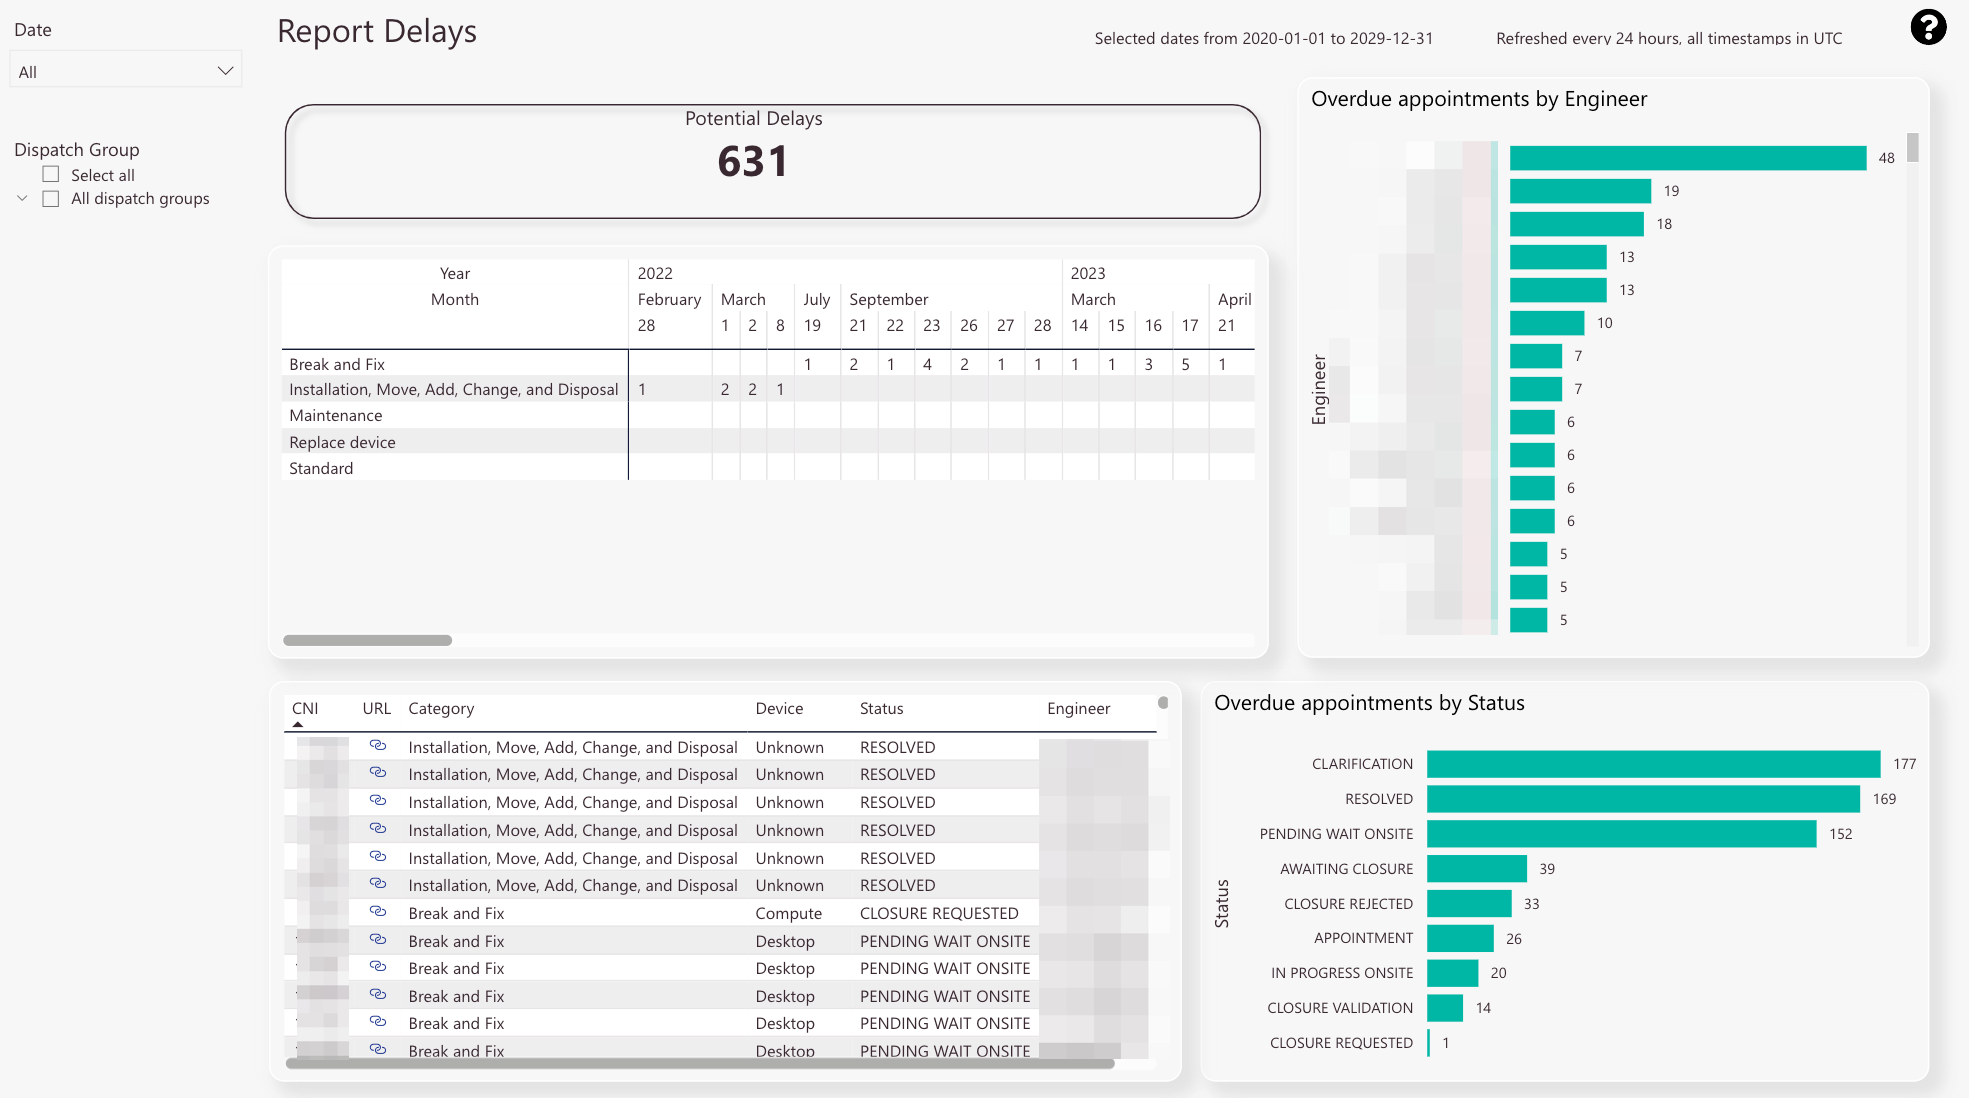
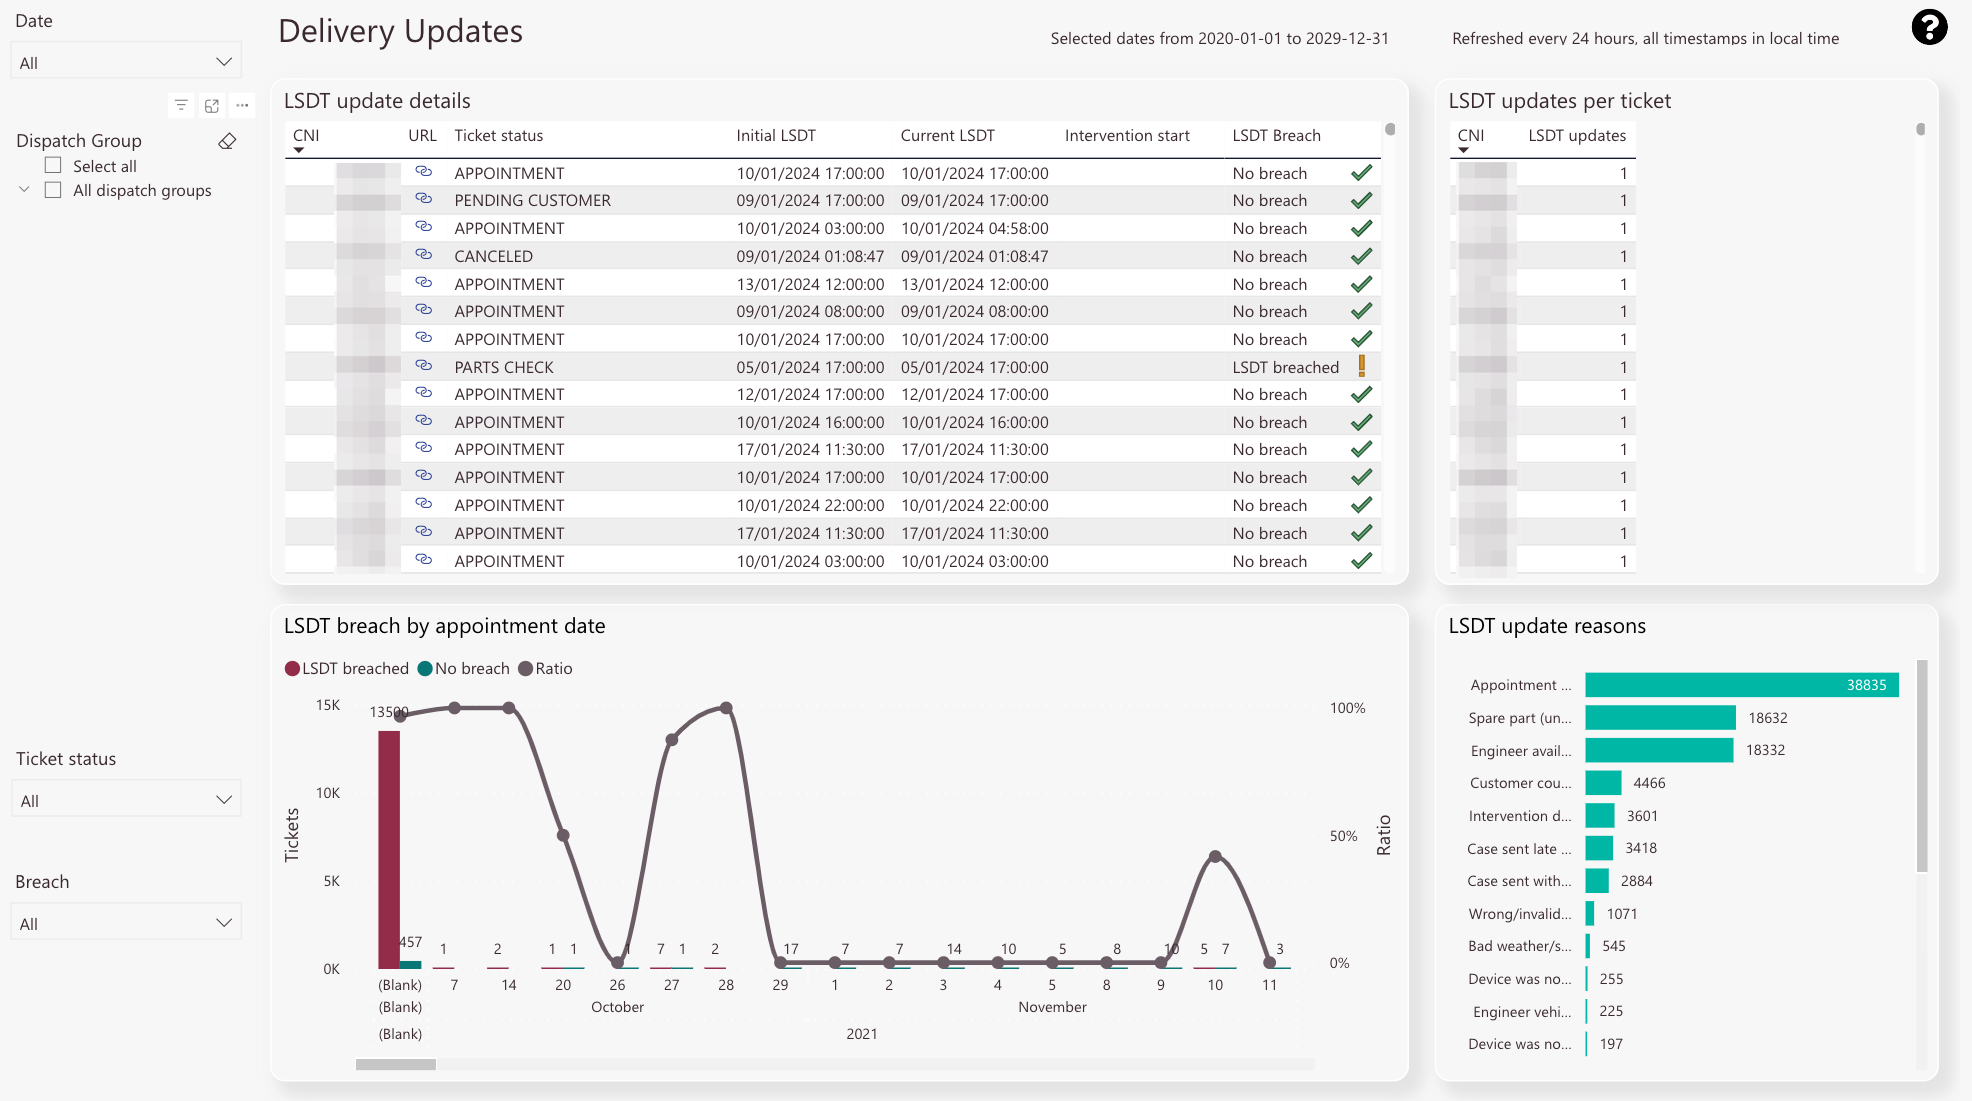
  • Date filter

  • Dispatch group filter

What is the particular purpose of this report?
To gain an overview of partner-assigned tickets.

What information can you get out of this particular report?
On the right-hand side, you can check the ticket amount per partner.
On the bottom-left side, you can check tickets sent to partners by device (ratio).
On the bottom-right side, you can check the ticket ratio by partner.

What does all the information stand for and how to read it?
Numbers are used as units. The numbers stand for the ticket amount.

Which related reports might be considered to get a clearer/more detailed picture of the information?
The Potential Delays tab, the Rescheduled Tickets tab, and the Customer Portal tab.

How can the report be customized using filters?
You can filter by months and years.
You can filter by a dispatch group or more dispatch groups.
You can combine the months/years filter with the dispatch groups filter.

The Report Delays tab displays the amount of tickets that should have been already closed by now, but are not yet due to potential delays.

  • The sum of selected potential delay tickets

  • Potential delay tickets split up by category and date

  • Chart of all selected overdue appointments split up by engineer

  • Detail view on particular potential delay tickets including info about the CNI, Deep Link to find the ticket, Category, Device, Status, and Engineer

  • Chart of all selected overdue appointments split up by status
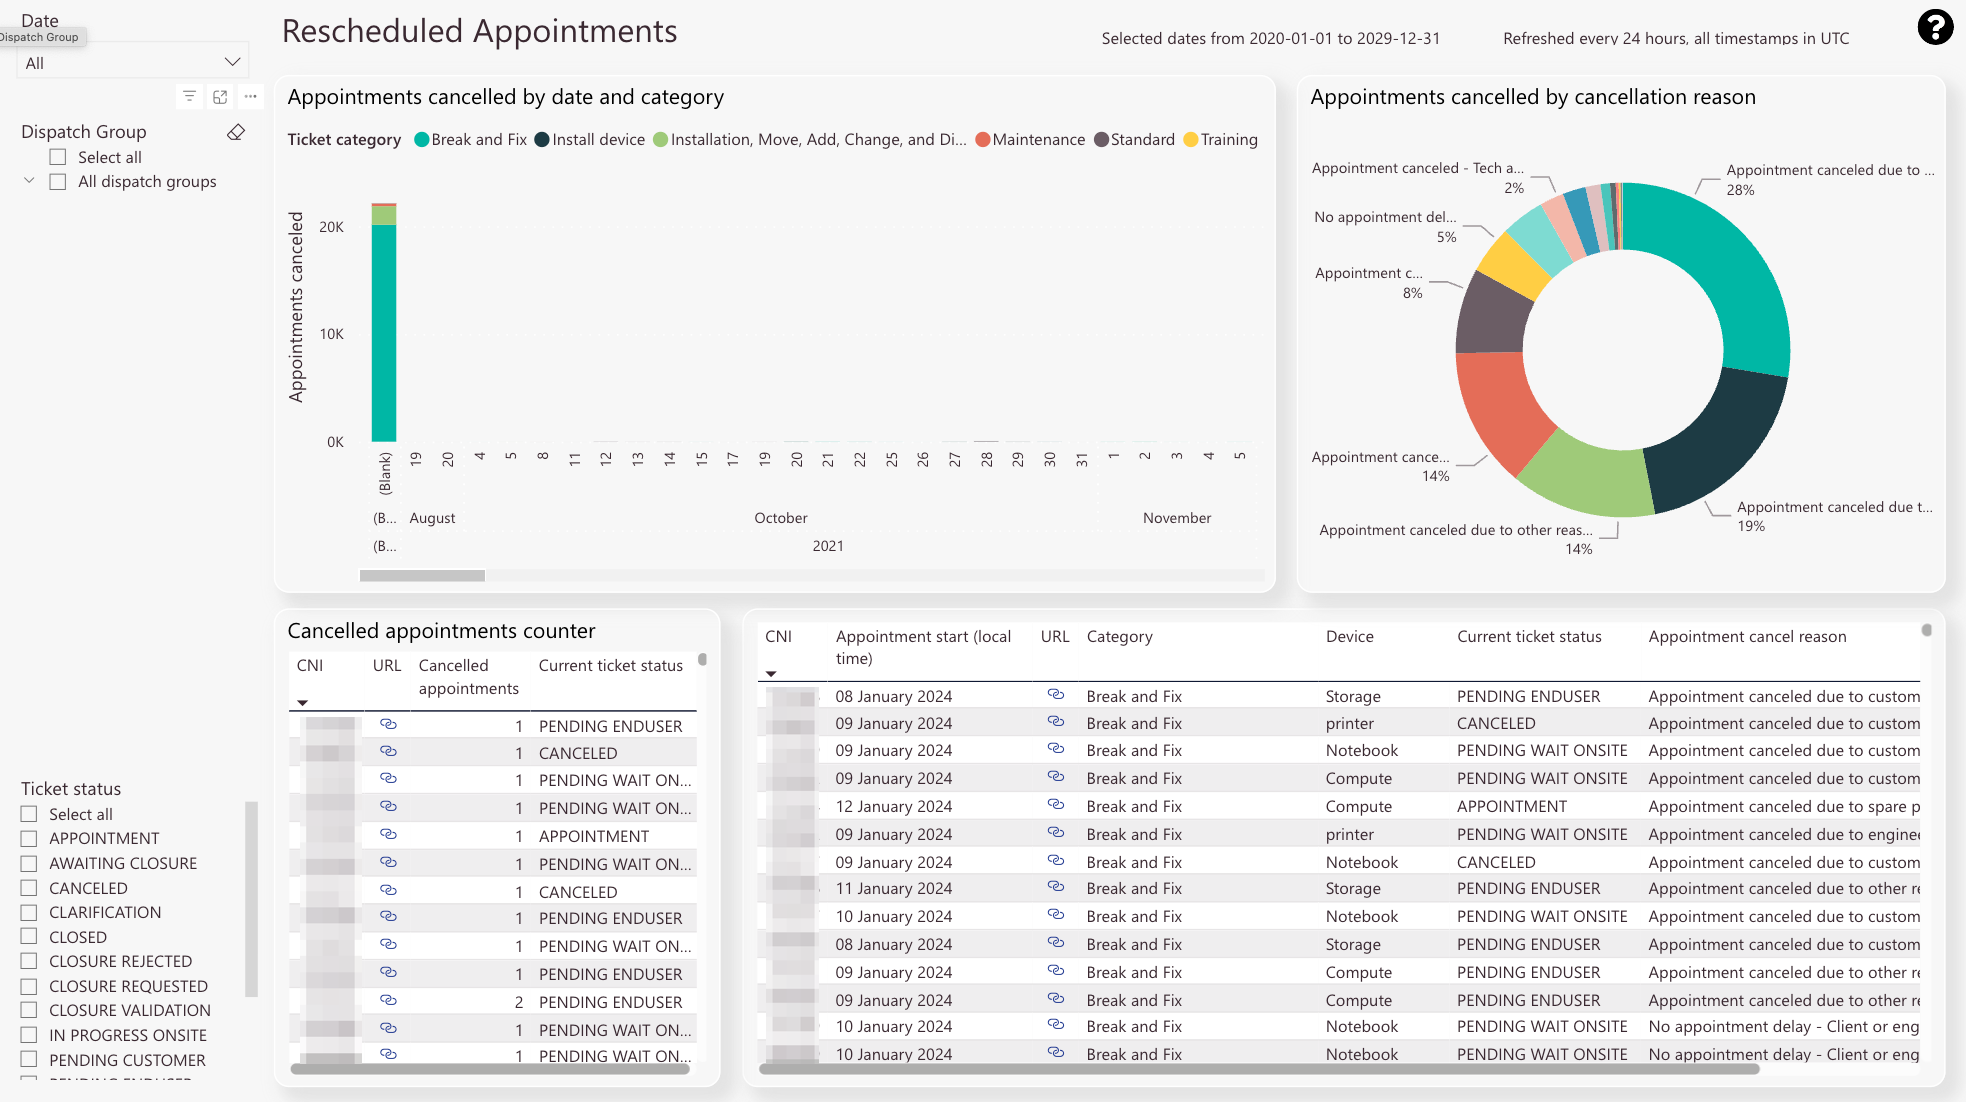
  • Date filter

  • Dispatch group filter

What is the particular purpose of this report?
To gain an overview of report delays.

What information can you get out of this particular report?
The top number shows you the total count of potential delay tickets.
The top view breaks potential delays down by date and category.
The bottom view gives you a detailed view of potential delay tickets including info about the CNI, Deep Link, Category, Device, Status, and Engineer.
The upper-right view displays a chart of all selected overdue appointments split up by engineer.
The lower-right view displays a chart of all selected overdue appointments split up by status.

What does all the information stand for and how to read it?
Numbers are used as units. The number indicates the ticket amount.

Which related reports might be considered to get a clearer/more detailed picture of the information?
The Assigned to Partners tab, the Rescheduled Appointments tab, and the Customer Portal tab.

How can the report be customized using filters?
You can filter by months and years.
You can filter by a dispatch group or more dispatch groups.
You can combine the months/years filter with the dispatch groups filter.

The Rescheduled Appointments tab displays all tickets have been rescheduled in some way.

  • Appointments cancelled by date and category.
    Different ticket categories have different colors.

  • Appointments cancelled split up by appointment cancel reason in per cent

  • Appointments canceled counter with Deep Link functionality to quickly find particular ticket.
    The counter includes the CNI, the Deep Link to find the ticket, the count, and the current ticket status.

  • Appointments canceled counter detail view.
    The detail view includes the CNI, the Appointment start time (local), the Deep Link to find the ticket, the device type, the current ticket status, and the appointment cancel reason, and the appointment ID (not relevant for end users).

  • Date filter

  • Dispatch group filter

  • Ticket status filter

What is the particular purpose of this report?
To gain an overview of rescheduled appointments.

What information can you get out of this particular report?
The Rescheduled Appointments tab displays all tickets have been rescheduled in some way.

What does all the information stand for and how to read it?
Numbers are used as units. The number indicates the ticket amount.

Which related reports might be considered to get a clearer/more detailed picture of the information?
The Assigned to Partners tab, the Potential Delays tab, and the Customer Portal tab.

How can the report be customized using filters?
You can filter by months and years.
You can filter by a dispatch group or more dispatch groups.
You can filter by
ticket status or ticket statuses.
You can combine all three filters together.

The Customer Portal tab compares tickets that have been processed traditionally with tickets that have been processed via the Customer Portal.
This allows, for example, conclusions to be drawn about how strongly the Customer Portal is accepted and used by end customers.

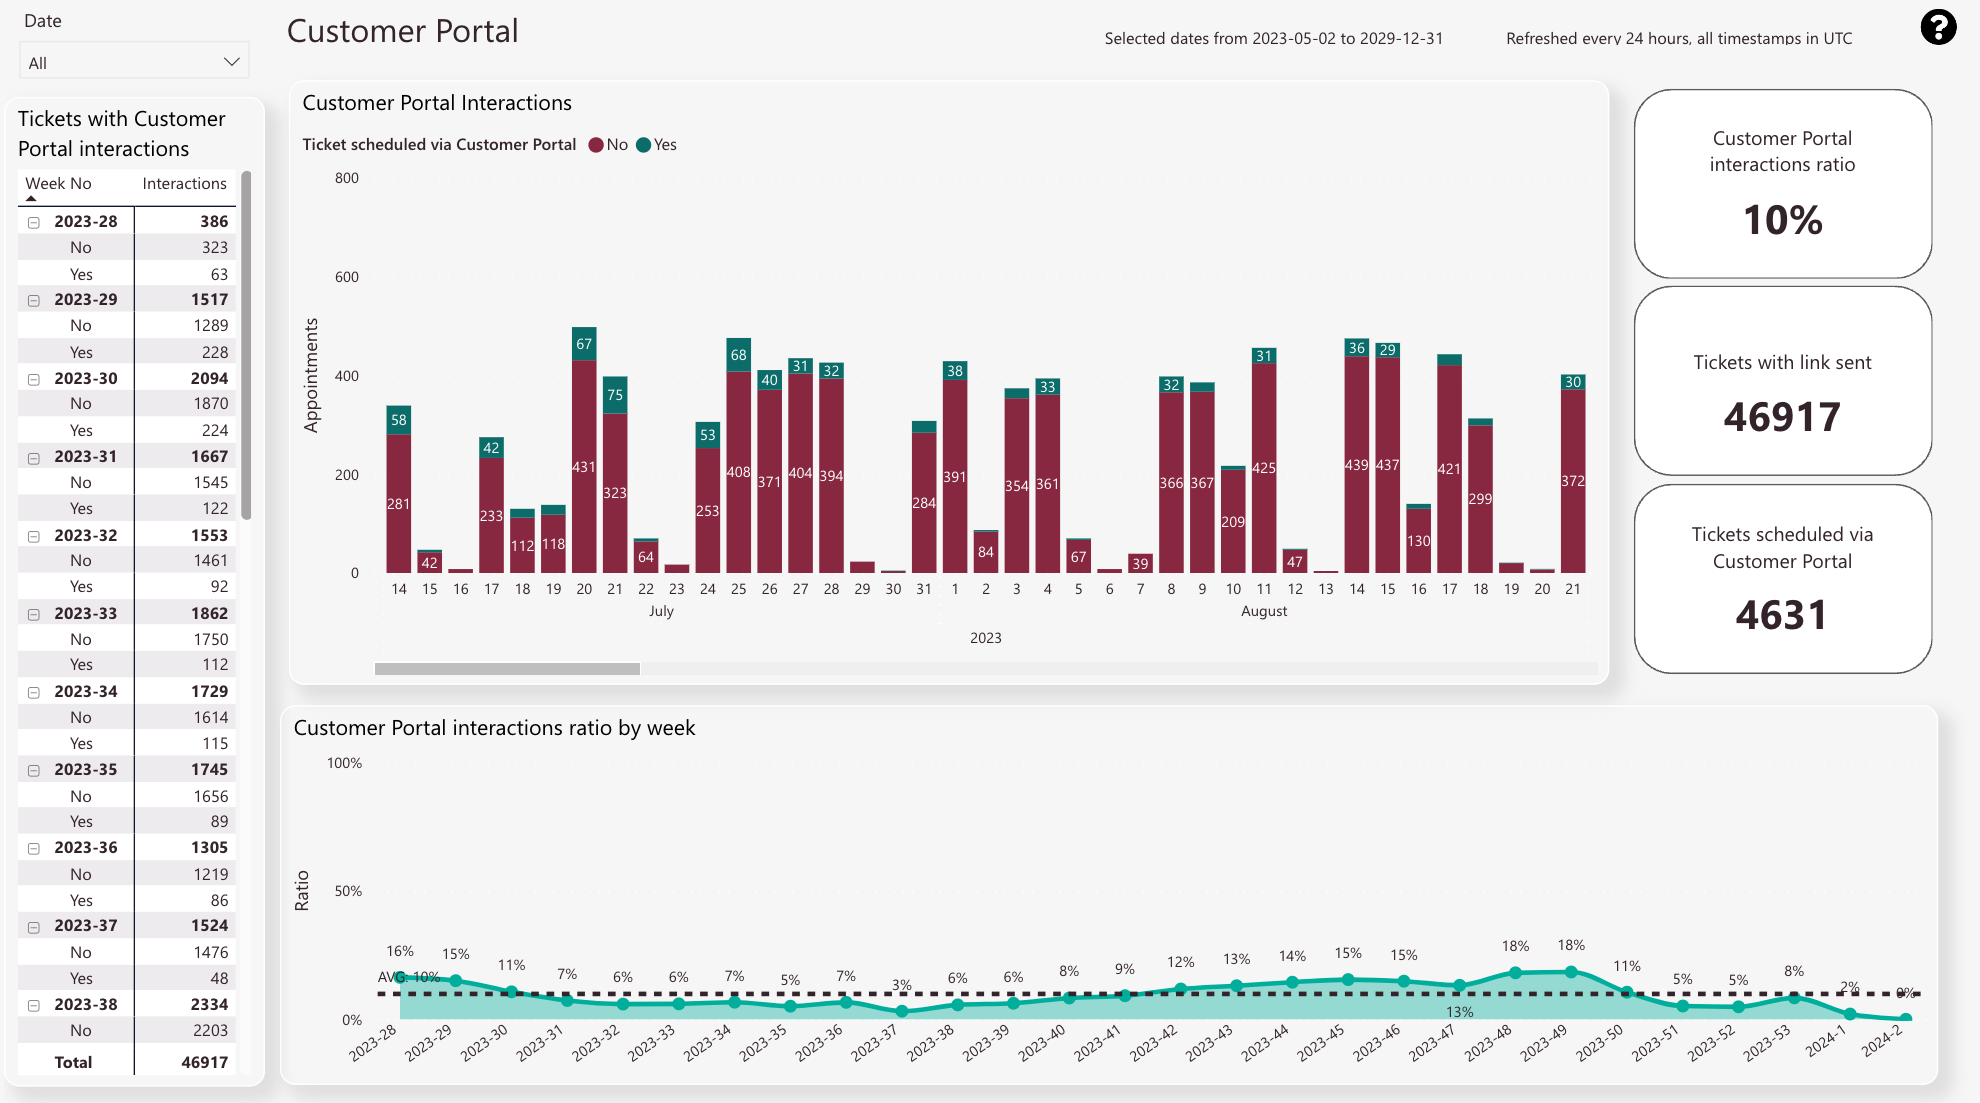
  • Compares traditional scheduled tickets with Customer Portal scheduled tickets by date

  • Displays the Customer Portal interactions ratio for selected date. If nothing is selected the total comparison will be displayed

  • Displays the selected or total ticket amount of tickets sent out containing a Customer Portal Link

  • Displays the selected or total ticket amount of tickets scheduled via the Customer Portal

  • Displays a trend of Customer Portal interactions ratio on a weekly basis.
    The Tickets scheduled via the Customer Portal number compared to the Tickets with the link sent number result in the Customer Portal interaction ratio.

  • Date filter

  • Interaction count separated by successful interaction (Yes) and unsuccessful interaction (No). The data is displayed on a per-week base.

What is the particular purpose of this report?
The Customer Portal tab compares tickets that have been processed traditionally with tickets that have been processed via the Customer Portal. 
This allows, for example, conclusions to be drawn about how strongly the Customer Portal is accepted and used by end customers.

What information can you get out of this particular report?
The top view compares traditional scheduled tickets with Customer Portal scheduled tickets by date.
The bottom view displays the trend of the Customer Portal interactions ratio on a weekly basis.
The upper-right view displays the Customer Portal interactions ratio for the selected date.
The upper-middle view displays the selected or total ticket amount of tickets sent out containing a Customer Portal Link.
The
lower-right view displays the selected or total ticket amount of tickets scheduled via the Customer Portal.
The Tickets scheduled via the Customer Portal number compared to the Tickets with the link sent number result in the Customer Portal interaction ratio.

What does all the information stand for and how to read it?
Numbers are used as units. The number indicates the ticket amount.

Which related reports might be considered to get a clearer/more detailed picture of the information?
The Assigned to Partners tab, the Potential Delays tab, and the Rescheduled Appointments tab.

How can the report be customized using filters?
You can filter by months and years.

The Delivery Updates give you insights into the Latest Service Delivery Time performance of your dispatch groups.

  • xy

  • Lorem ipsum dolor sit amet, consectetur adipisicing elit. Culpa enim esse excepturi nemo nesciunt officia officiis optio.
  • Lorem ipsum dolor sit amet, consectetur adipisicing elit. Culpa enim esse excepturi nemo nesciunt officia officiis optio.
  • Lorem ipsum dolor sit amet, consectetur adipisicing elit. Culpa enim esse excepturi nemo nesciunt officia officiis optio.
  • Lorem ipsum dolor sit amet, consectetur adipisicing elit. Culpa enim esse excepturi nemo nesciunt officia officiis optio.
  • Lorem ipsum dolor sit amet, consectetur adipisicing elit. Culpa enim esse excepturi nemo nesciunt officia officiis optio.
  • Lorem ipsum dolor sit amet, consectetur adipisicing elit. Culpa enim esse excepturi nemo nesciunt officia officiis optio.
  • Lorem ipsum dolor sit amet, consectetur adipisicing elit. Culpa enim esse excepturi nemo nesciunt officia officiis optio.
Was this topic helpful?
5 out of 5 stars

1 rating

5 Stars 100%
4 Stars 0%
3 Stars 0%
2 Stars 0%
1 Stars 0%
5
How can we further improve this topic?
Please submit the reason for your vote so that we can improve this topic.
Navigation