Tip: You can use filters for better results
-
Latest News
-
Getting Started
-
Work Place
-
-
-
- About Buttons
- Action Buttons
- Schedule Tickets
- Ticket Info and COMS Buttons
- Add Parts
- Assign Partners
- Remove Tickets from the Ticket Clipboard
- Inline Skill Editing
- Create Intervention Info
- Create Intervention Reports
- Cancel Tickets
- Cancel Appointments
- Clone Tickets
- Edit Ticket Details
- Edit Privat Notes
- Report Tickets
- Close Tickets
-
Admin Panel
-
FMA 2 App
-
Customer Portal
How to use the Analytics Live Report
The Analytics Live Report provides you with various insights about the daily progress, critical tickets, and ticket volume.
What is the particular purpose of the Analytics Live Report?
To comprehend daily ticket on-goings and daily ticket volumes.
Who benefits most from the Analytics Live Report?
This view has no specific person group and can be useful for almost everybody working with the Fieldcode system. Dispatchers and the backend office for example can profit from the progress today view, critical tickets while team leaders or managers for example can draw their conclusions from the Tickets volume tab.
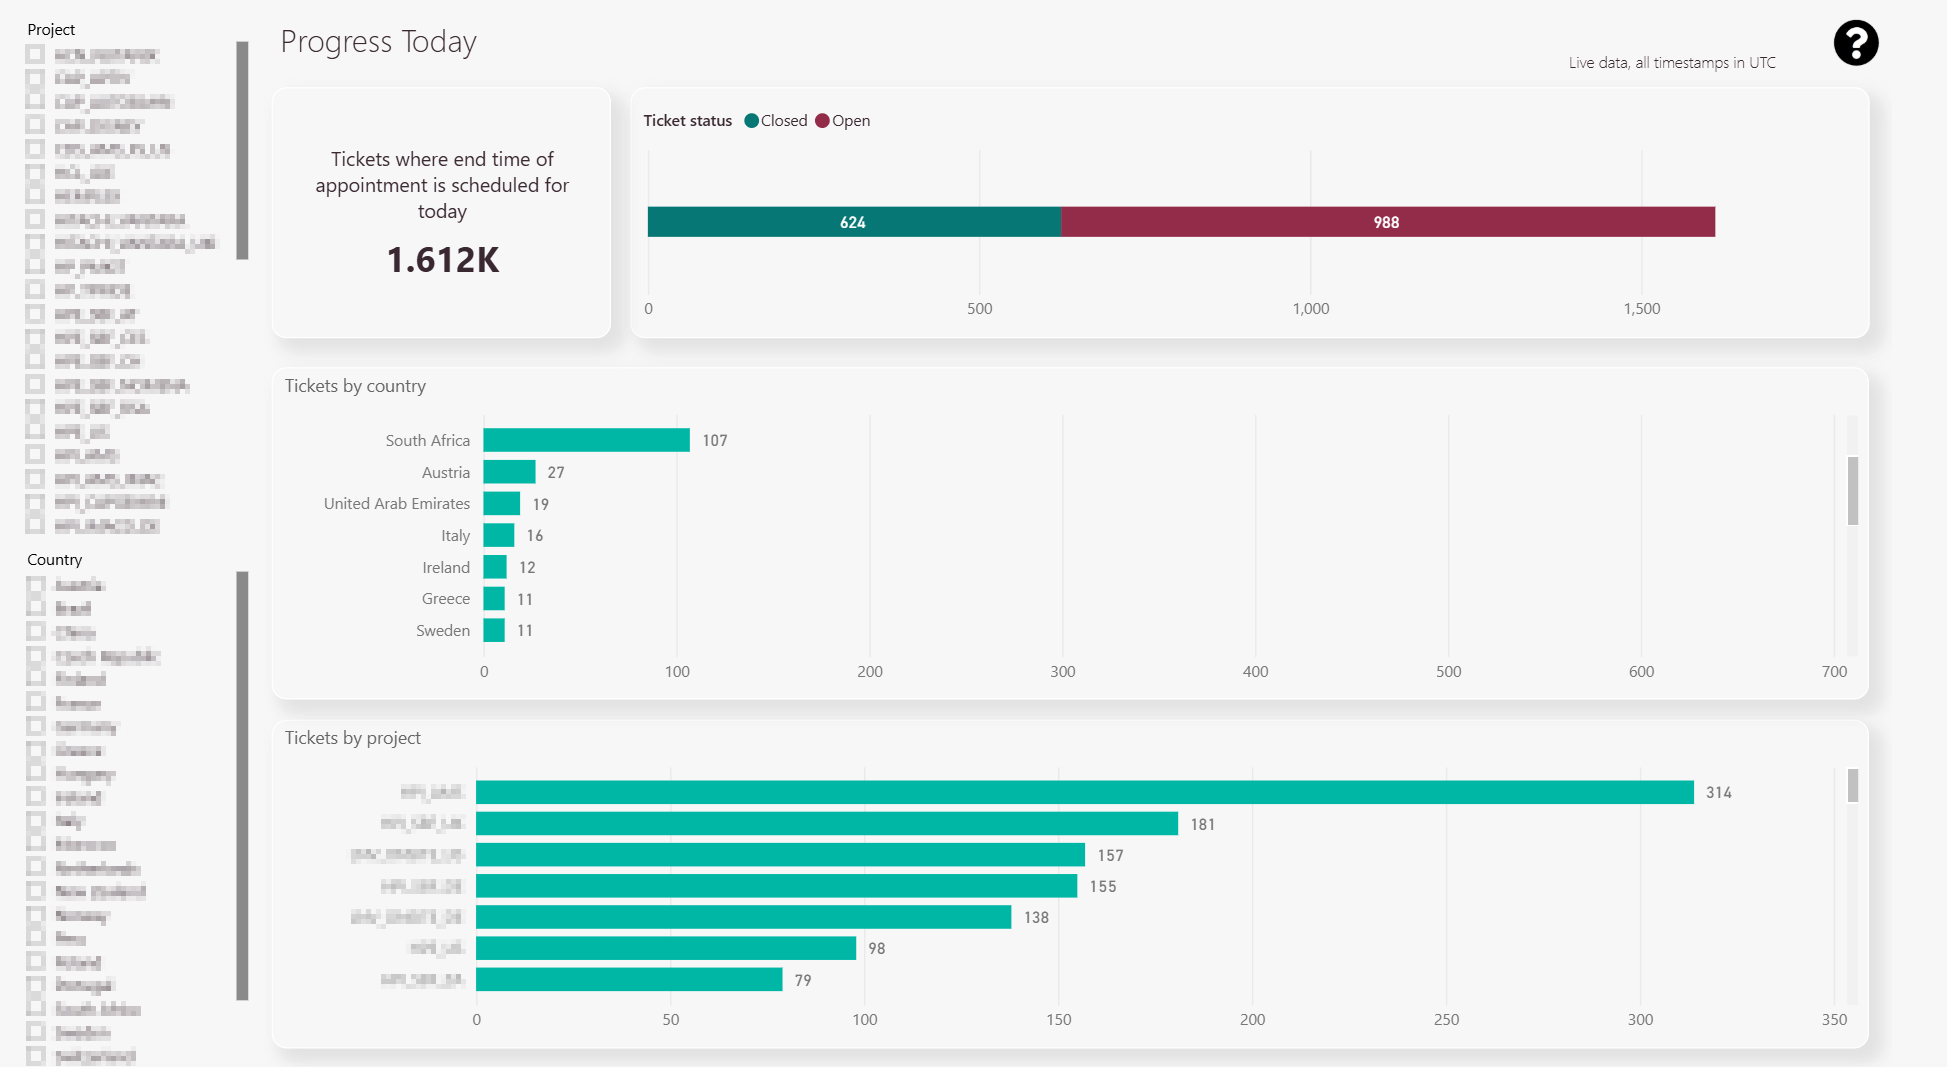
Progress today
The progress today tab displays open, and closed tickets of the day.
In the drilled-down view, you can evaluate these tickets by country, or by project.
-
Closed and open tickets.
-
Ticket sum for the selected country.
-
Ticket sum by project -> Allows you to compare ticket sum by different projects
-
Project splicer
-
Country splicer
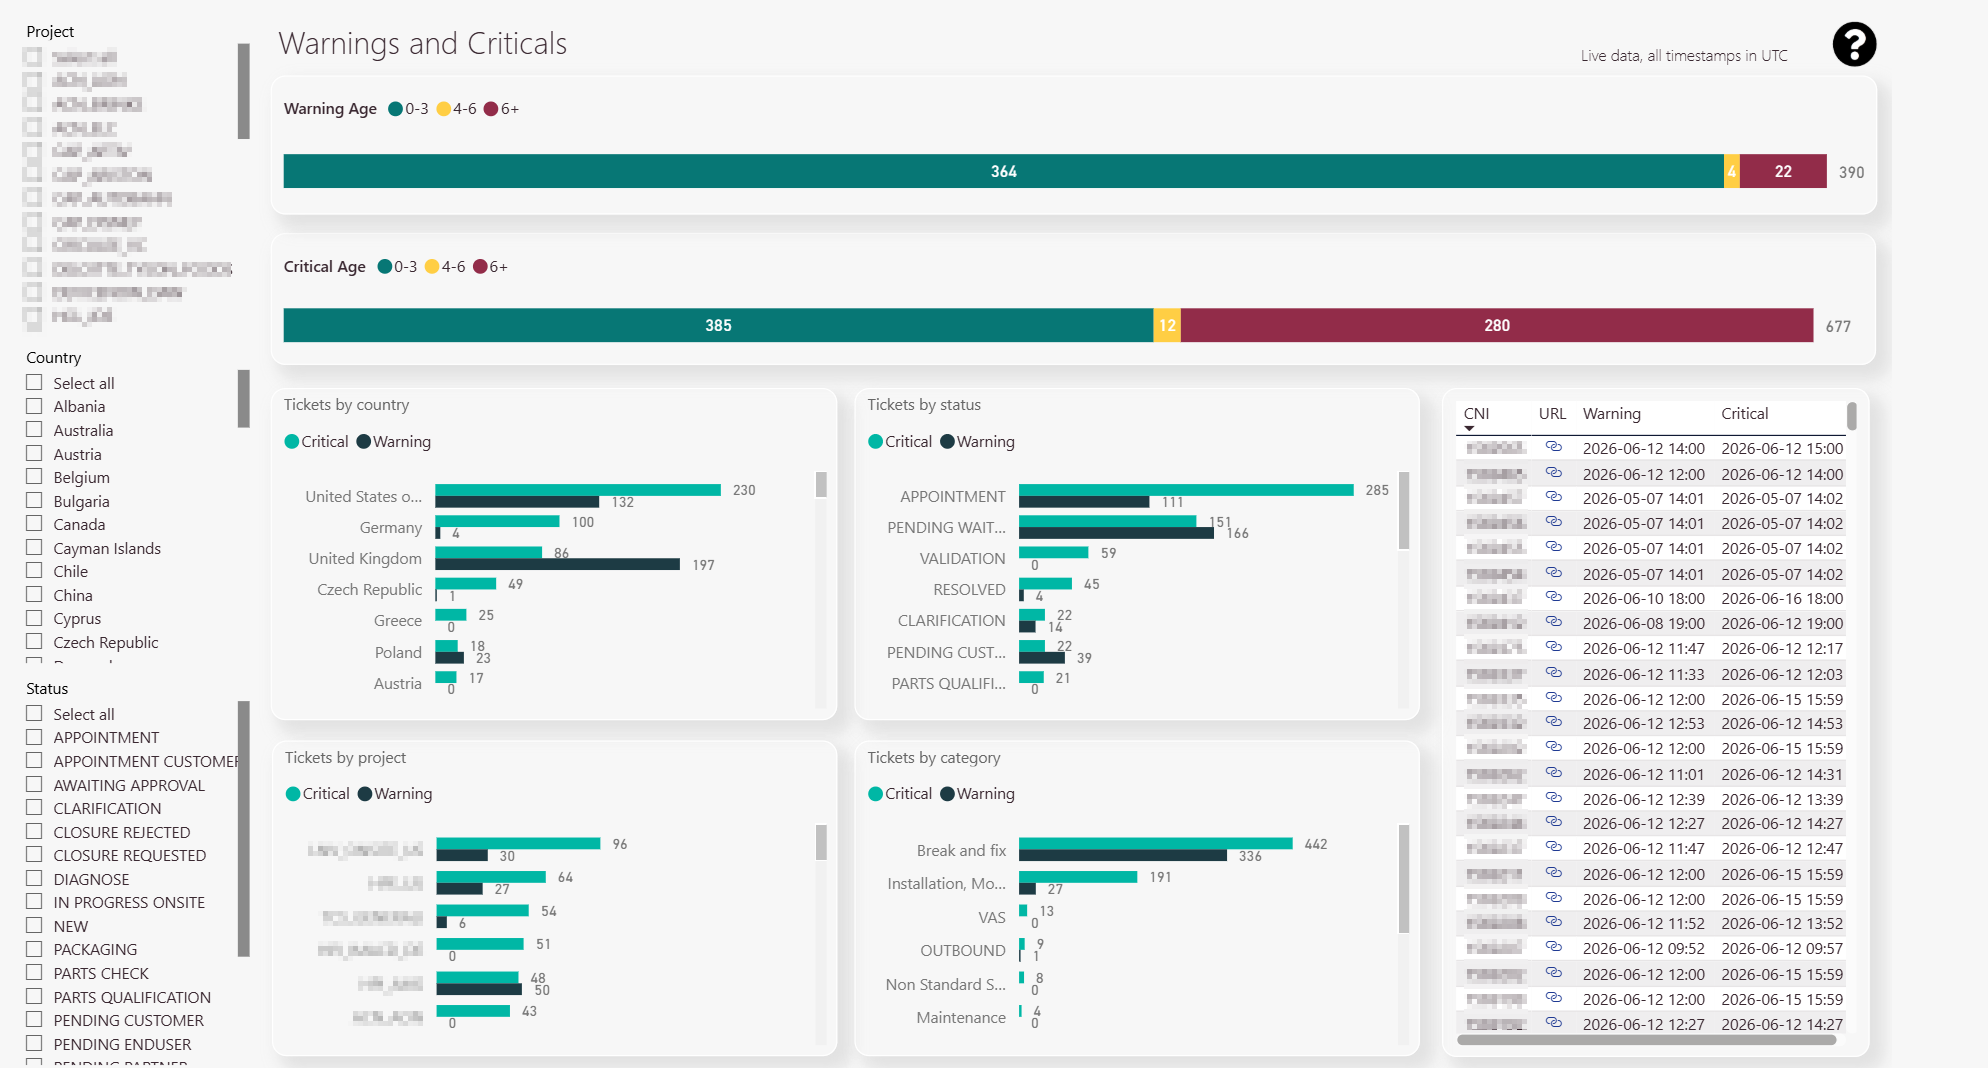
Critical tickets
The Critical tickets tab displays all critical tickets (divided by age in days).
In the drilled-down view, you can evaluate these tickets categorized by country, project, status, ticket category, and by engineer.
-
Critical tickets separated by ticket age.
-
Critical tickets separated by country.
-
Critical tickets separated by status.
-
Critical tickets separated by project.
-
Critical tickets separated by category.
-
Project splicer
-
Country splicer
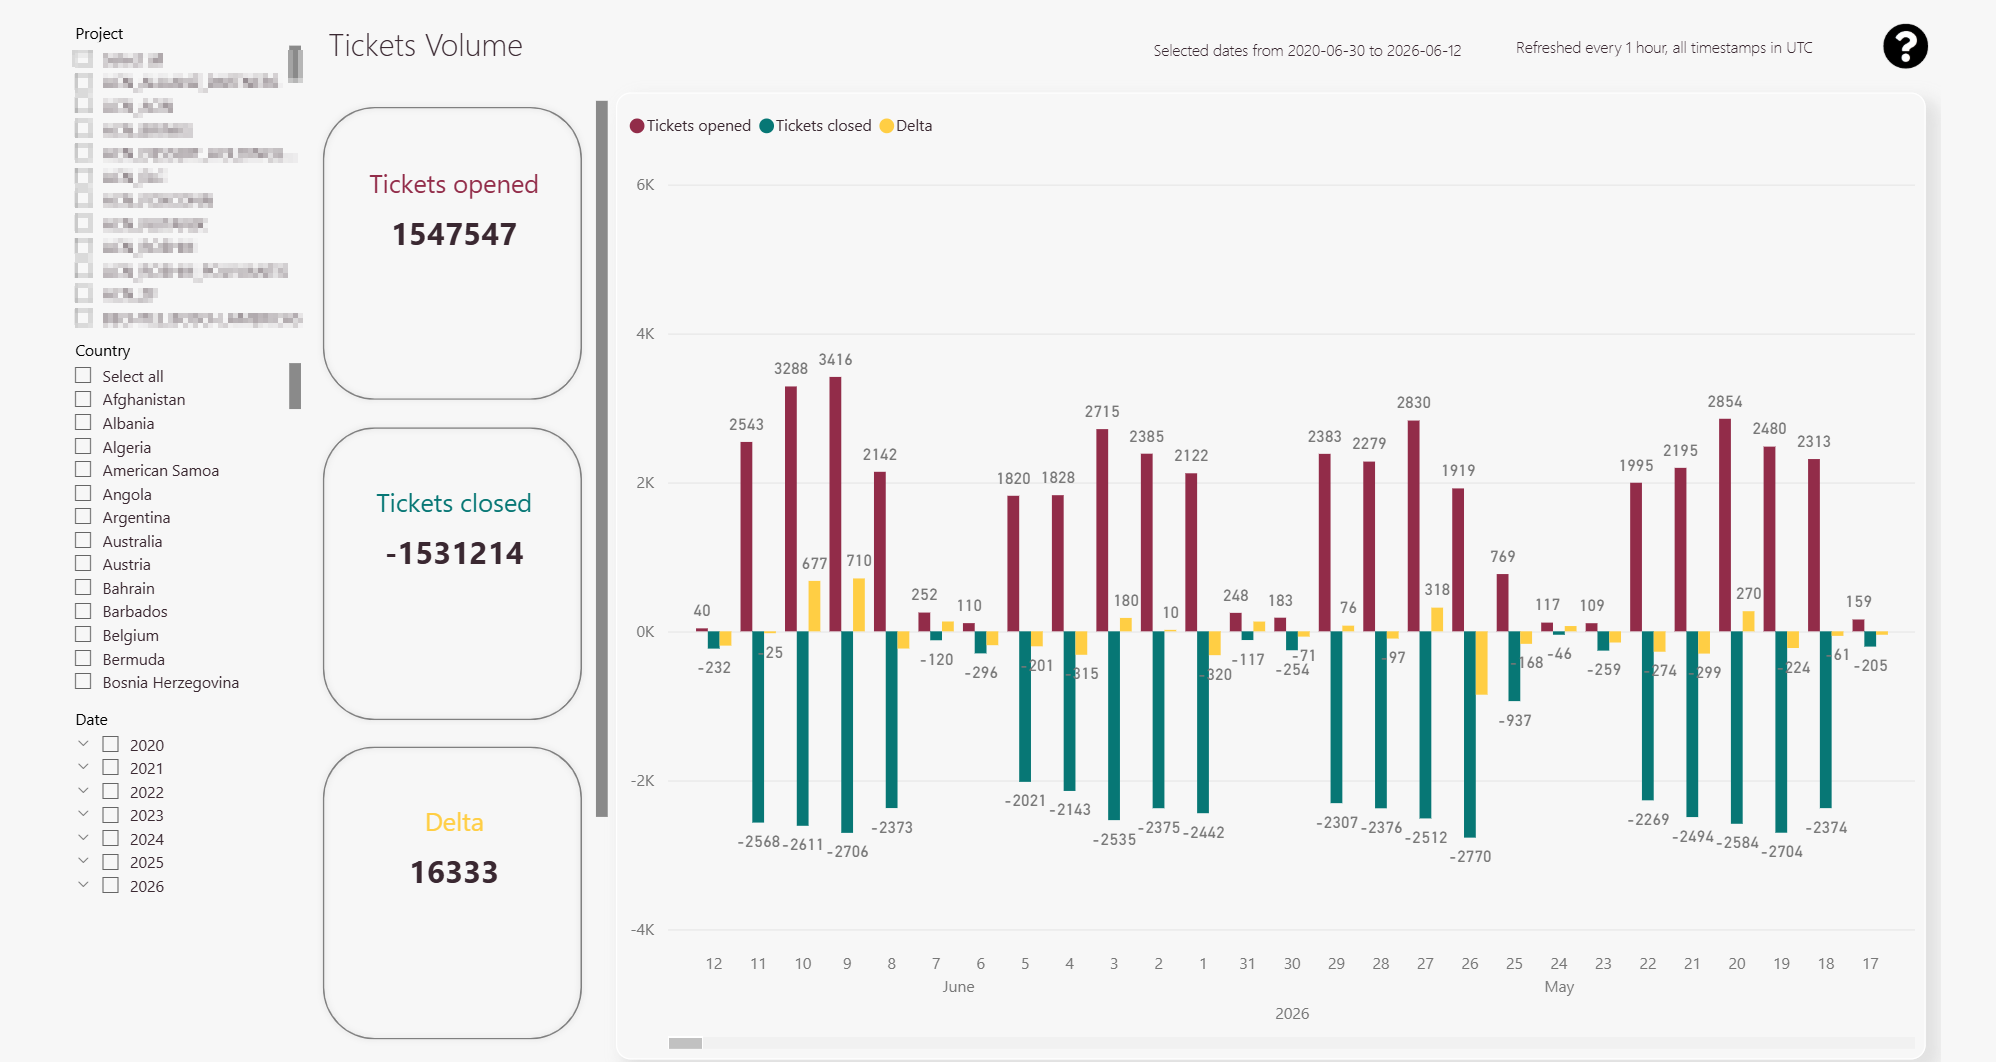
Tickets volume
The tickets volume tab displays an overview of all tickets from the last 14 days categorized by project or by country.
In the drilled-down view displayed are the overall backlog, tickets opened for the last 14 days, the tickets closed for the last 14 days, and the delta between opened and closed tickets for the last 14 days.
-
The daily ticket volume is displayed including opened tickets, closed tickets, and the corresponding delta.
Additionally you can see the backlog for all time on the left side of the graphical processed data. -
The slider lets you scroll through particular days.
-
Project splicer
-
Country splicer
-
Month splicer
5 out of 5 stars
1 rating
| 5 Stars | 100% | |
| 4 Stars | 0% | |
| 3 Stars | 0% | |
| 2 Stars | 0% | |
| 1 Stars | 0% |