Tip: You can use filters for better results
-
Latest News
-
Getting Started
-
Work Place
-
-
-
- About Buttons
- Action Buttons
- Schedule Tickets
- Ticket Info and COMS Buttons
- Add Parts
- Assign Partners
- Remove Tickets from the Ticket Clipboard
- Inline Skill Editing
- Create Intervention Info
- Create Intervention Reports
- Cancel Tickets
- Cancel Appointments
- Clone Tickets
- Edit Ticket Details
- Edit Privat Notes
- Report Tickets
- Close Tickets
-
Admin Panel
-
FMA 2 App
-
Customer Portal
About Interface Monitoring
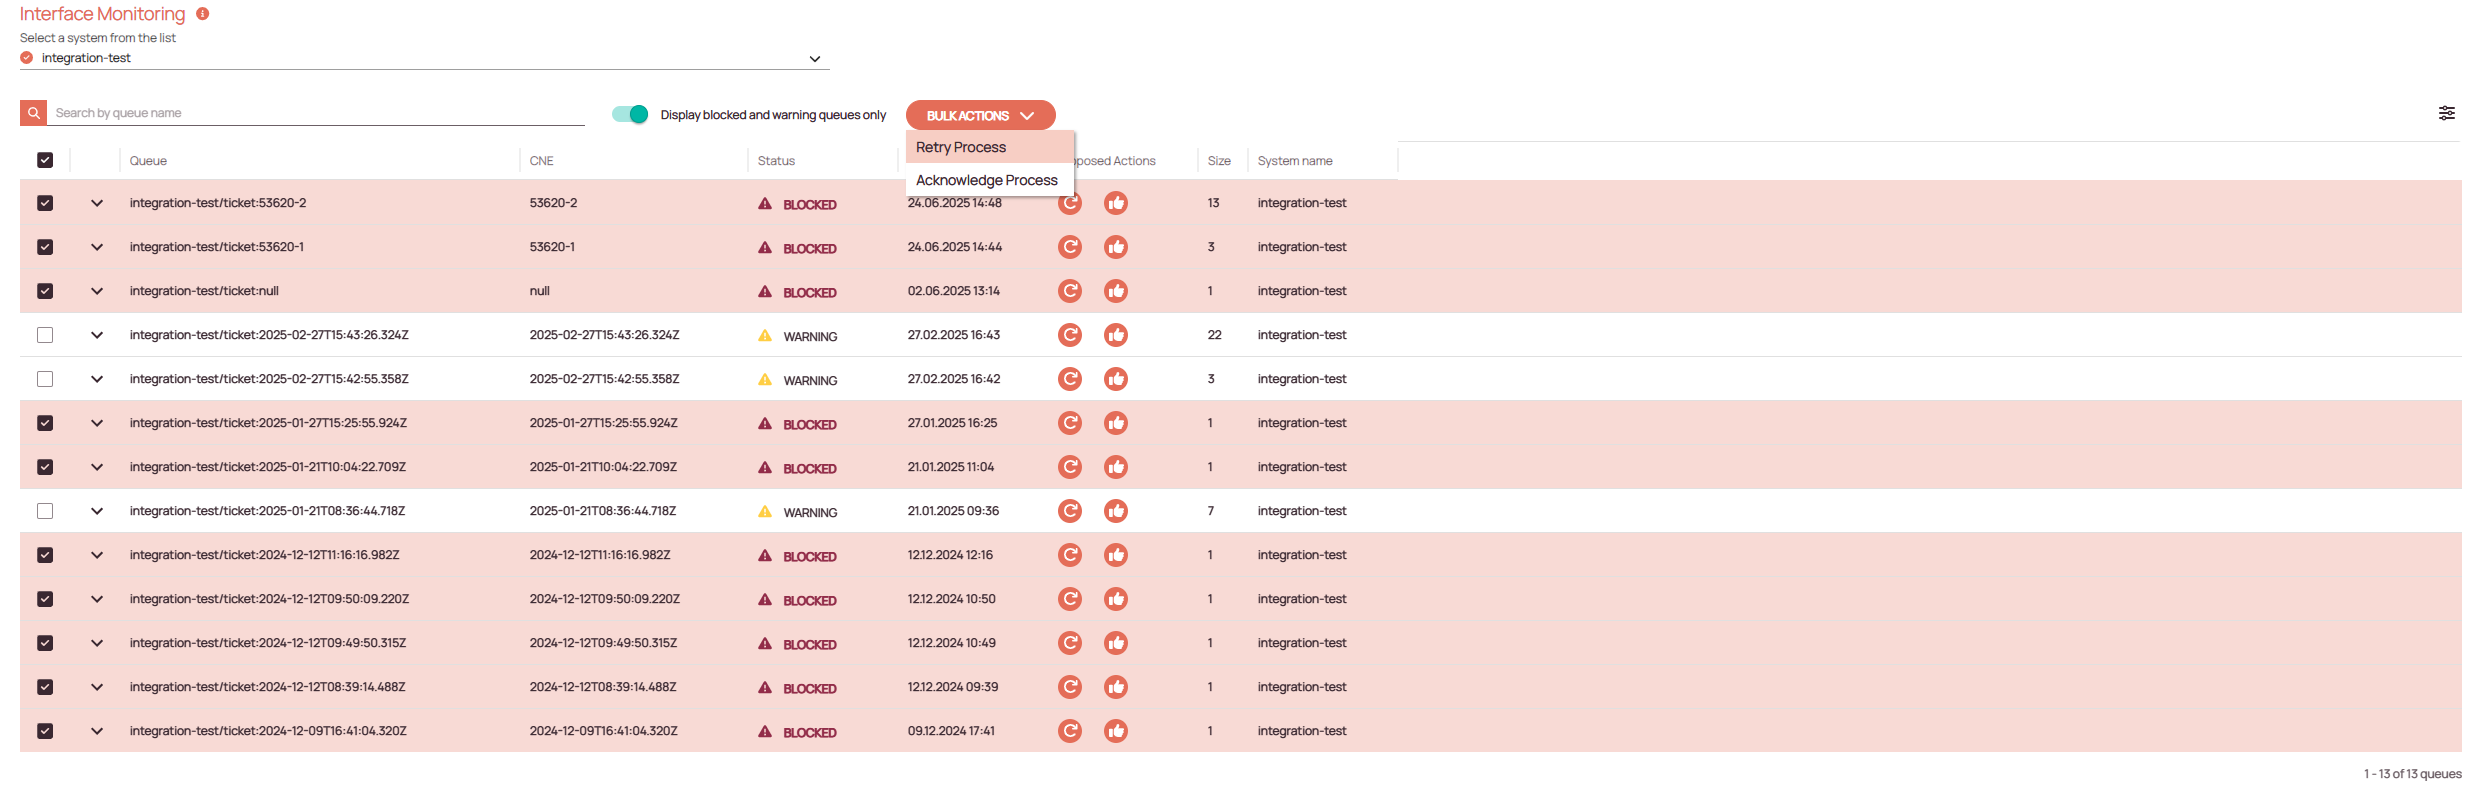
The Interface Monitoring page allows you to check and troubleshoot all your existing interface connections. You can monitor multiple connections to ensure they are functioning correctly. Monitoring is organized into queues and processes:
- A queue is the parent of one or more processes.
- A process is the child of a queue.
- Retrying a queue will also retry all nested child processes.
- Retrying a process affects only the selected process.
- Acknowledging allows you to leave a comment and mark the issue as known.
Use the Refresh button to reload the latest state of queues and processes.
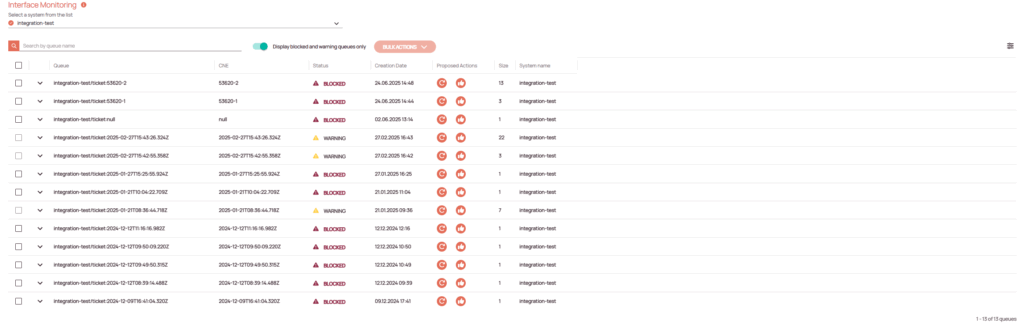
- Select the interface connection that you want to monitor from the drop-down.
- (Optional) – Search the system connection by entering a keyword inside the search field.
- (Optional) – Flip the “Display errors toggle” to the right in case you just want to troubleshoot and not just have a look at all queues and processes.
Accessing the Interface Monitoring page
Navigate to Interfaces -> Interface Monitoring to troubleshoot and monitor interface connections.
Troubleshooting Queues
Troubleshooting a queue will also troubleshoot all underlying child processes. There are currently two options to troubleshoot a queue. You can either retry or acknowledge the queue.
A queue can currently have the following statuses:
- ✅ OKAY: The queue has no issues.
- ⛔ BLOCKED: The queue is blocked and non-functional.
- 📝 ACKNOWLEDGED: The queue contains a “Acknowledge process result”.
- ⚠️ WARNING: Indicates that a non-blocked queue contains one or more “REJECTED” processes (more than 1).
- ❌ REJECTED: A “REJECTED” process is nested inside a queue.
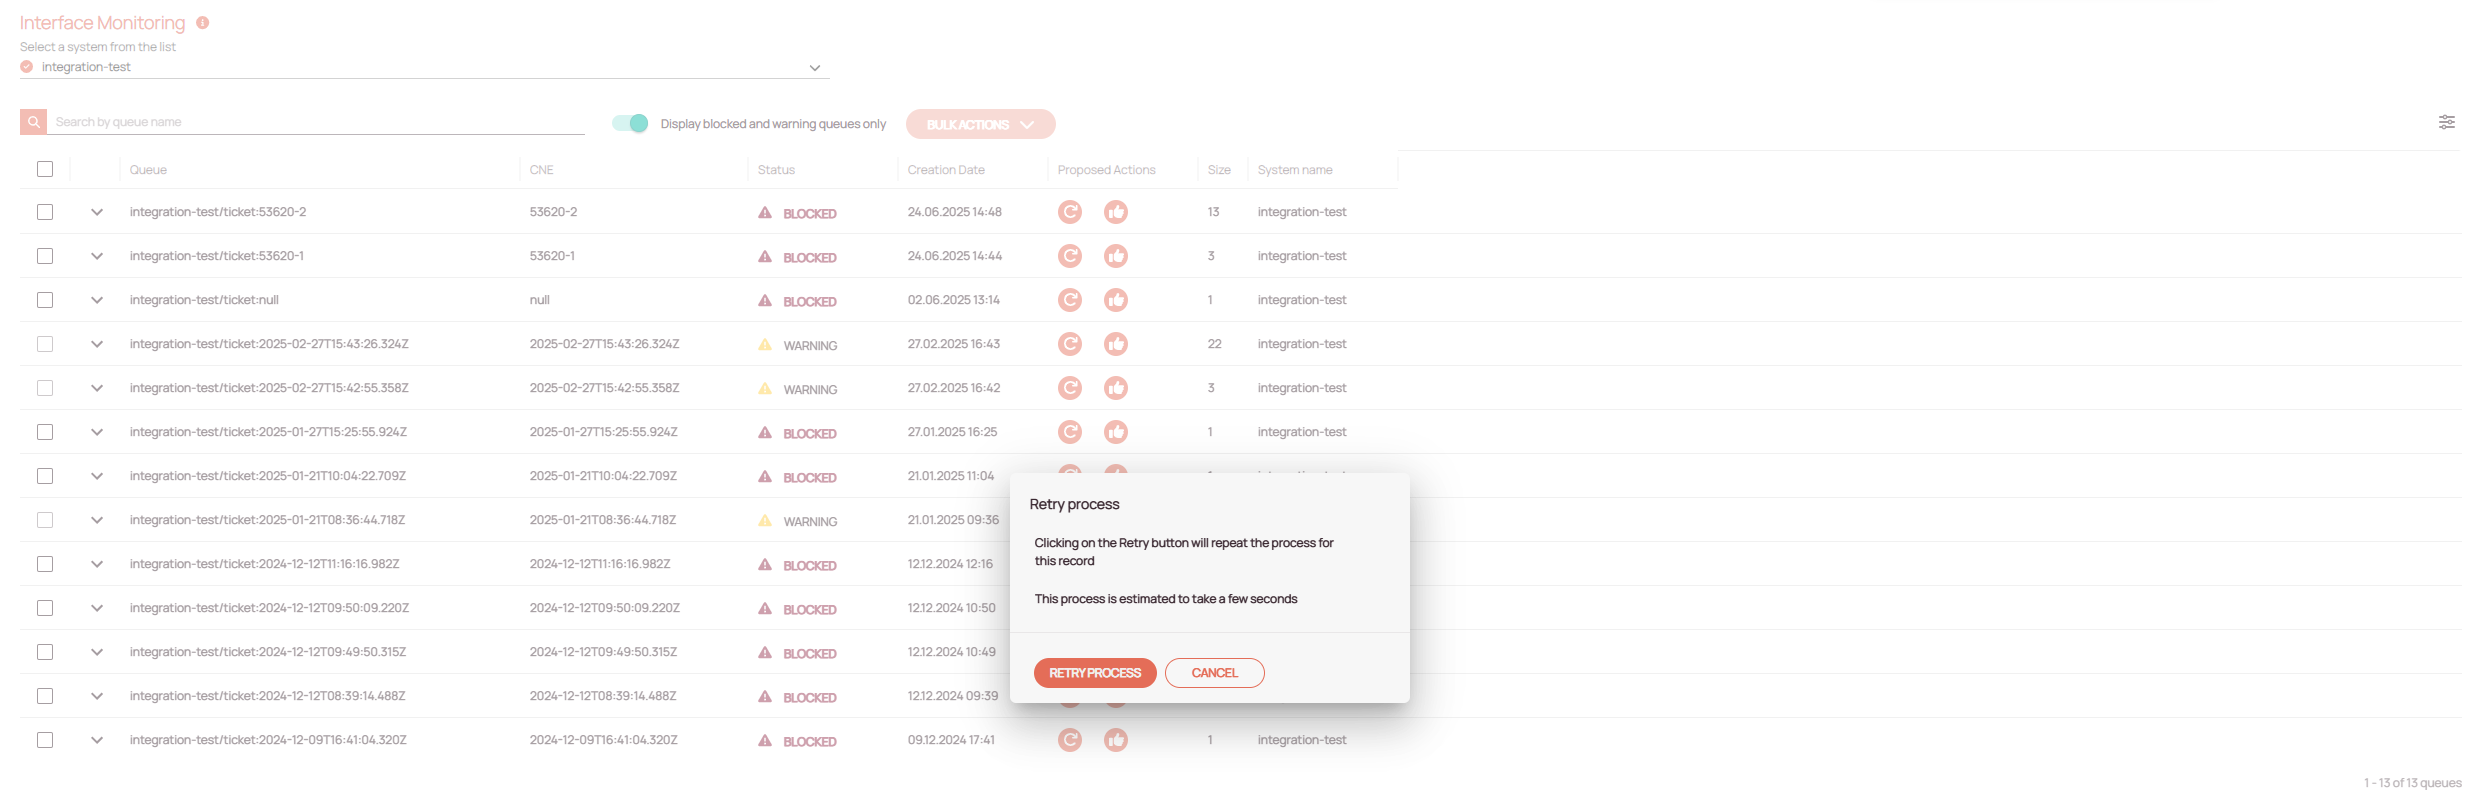
Retrying Queues
- Click on the Retry button.
- Confirm the retry.
- In the best case, the queue is fixed.
- In the worst case, developers should be able to help you if you provide them with further logs and details.
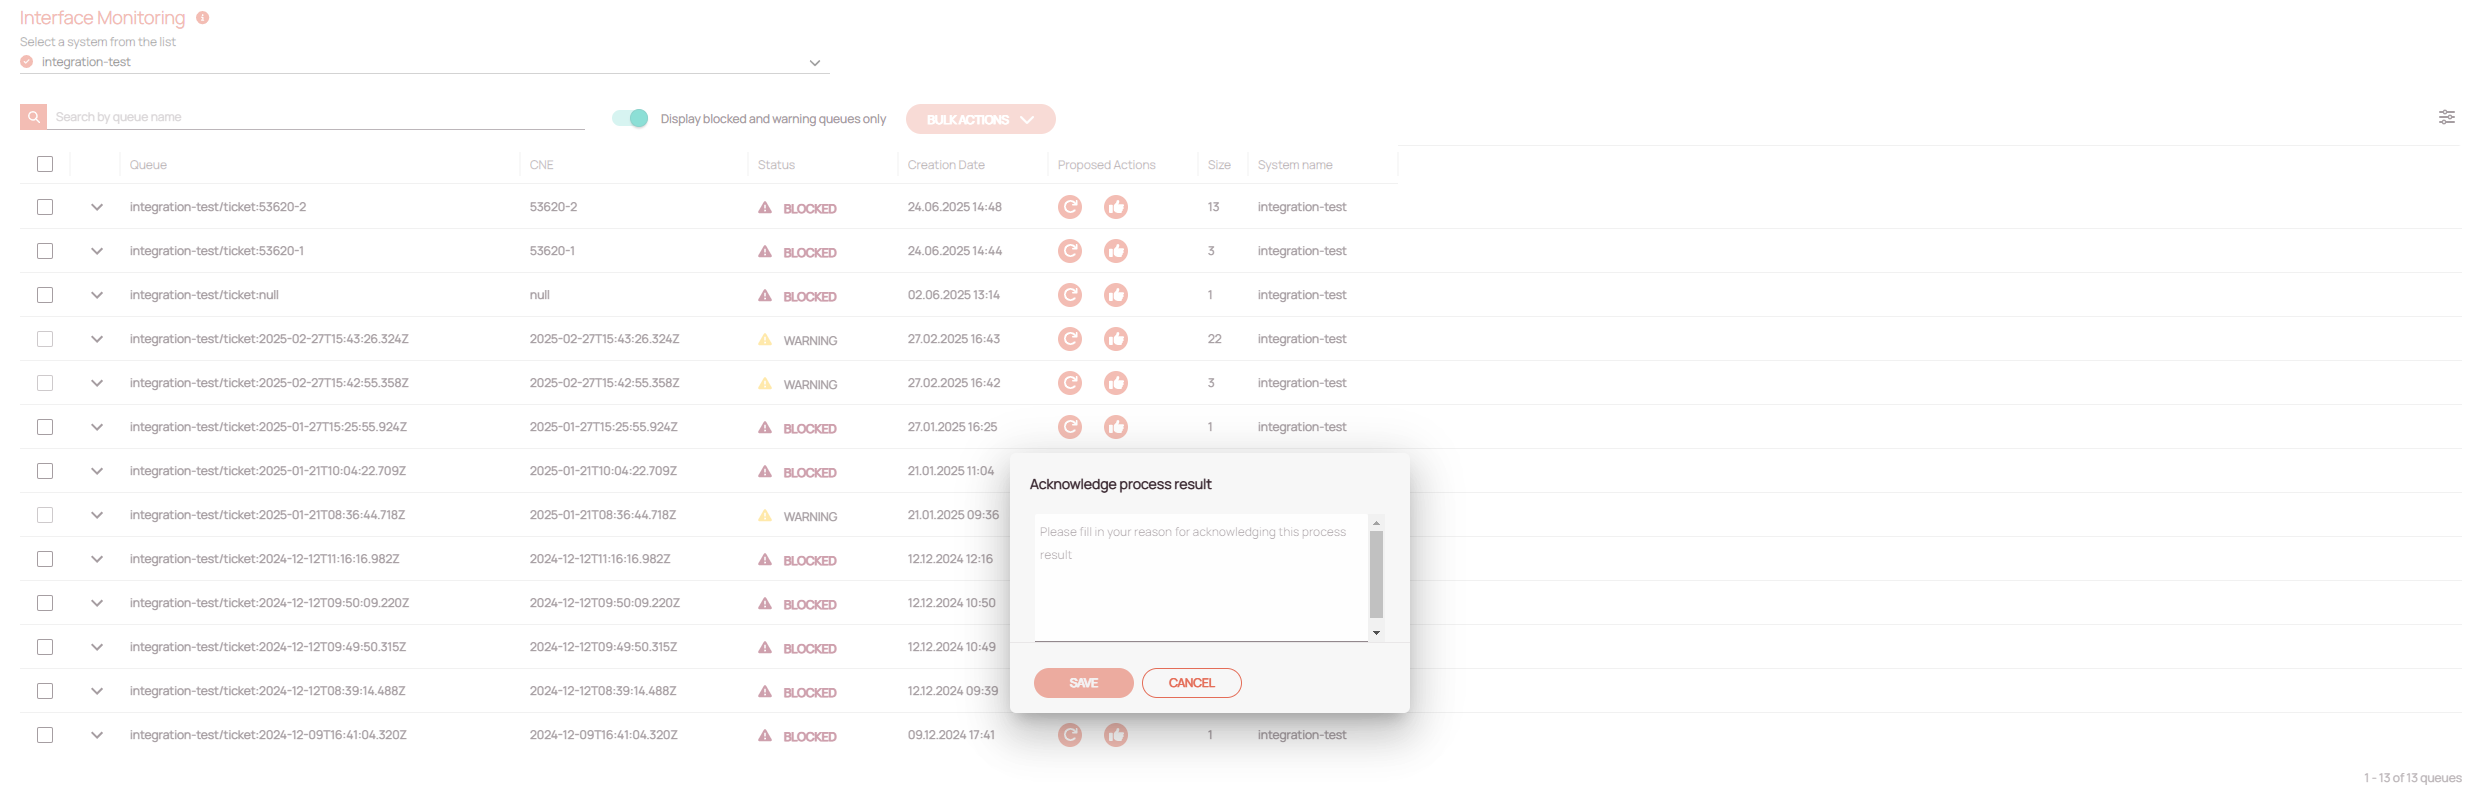
Acknowledging Queues
- Click on the Acknowledge button.
- Insert a comment, if you know what the problem is.
- Click Save.
- In the best case, everybody using the queue is now aware of the problem and developers can try to fix it.
Troubleshooting Processes
Troubleshooting a process will troubleshoot only the particular process. There are currently two options to troubleshoot a process. You can either retry or acknowledge the process.
A process can have the following statuses:
- 🕒 PENDING: The process is currently pending.
- ⚙️ INITIALIZING PROCESSING: The process is currently initializing.
- ✅ DONE: The process is done.
- ❌ REJECTED: A “REJECTED” process is nested inside a queue.
- 📝 ACKNOWLEDGED: The process contains a “Acknowledge process result”.
Retrying Processes
- Click on the Retry button.
- Confirm the retry.
In the best case, the process is fixed
In the worst case, the problem persists and developers should be able to help you if you provide them with further logs and details.
Bulk Actions
Retries and acknowledgements can be handled in bulk.
- Select the processes or queues
- Confirm the retry or acknowledgement
Test Run & Debugging Tools
To make testing and troubleshooting easier, we’ve added new tools that allow you to simulate mappings and monitor logs in real time.
Test Run Options:
You can now run:
- Outgoing Mapping (workflow webhooks only) using a selected entity
- Incoming Mapping using a custom payload
This helps you test and fix issues faster – without needing live data.
How It Works:
Workflow Event Listener Test
Use a selected entity (protoSpecId,protoId) to trigger a test run. This creates a new process using the selected event listener and entity as payload.DC Endpoint Test
Provide your own payload to simulate an incoming mapping. This creates a new process using the selected DC endpoint and your payload.
Print & Log Operations
To support deeper debugging, we’ve added print operations and a process log monitor.
Options:
PrintOperation
You can now include print statements in your mapping logic to output custom messages.OutputCollector Interface
This collects printed messages during evaluation. If no collector is attached, a warning is logged and print calls are skipped.LoggingOutputCollector (optional)
For advanced users, this implementation forwards messages to a logger (e.g.,java.util.logging.Logger).
Process Log Enhancements
Each process now includes an output log:
[
  {
    "timestamp": "2025-08-07T14:00:00Z",
    "message": "Webhook triggered with protoId 12345"
  }
]
These logs are:
- Sent to a Kafka topic with the process ID
- Collected by a Kafka listener and added to the process log
- Streamed live via WebSocket so you can monitor execution in real time
Acknowledging Processes
- Click on the Acknowledge button.
- Insert a comment, if you know what the problem is.
- Click Save.
- In the best case now everybody using the process is aware of the problem and developers can try to fix it.
Checking Process Details & Downloading .json Files
- Clicking on a particular process will result in the process details opening.
- From there on you can download log files/retry/acknowledge and refresh a process.
- In the API History tab, you can also download particular request and response .json files and as well analyze the history of the process involved APIs.
Why This Matters
These tools make it easier to:
- Validate mappings before deployment
- Debug complex workflows
- Monitor integration behavior in real time
5 out of 5 stars
1 rating
| 5 Stars | 100% | |
| 4 Stars | 0% | |
| 3 Stars | 0% | |
| 2 Stars | 0% | |
| 1 Stars | 0% |