Tip: You can use filters for better results
-
Latest News
-
Getting Started
-
Work Place
-
-
-
- About Buttons
- Action Buttons
- Schedule Tickets
- Ticket Info and COMS Buttons
- Add Parts
- Assign Partners
- Remove Tickets from the Ticket Clipboard
- Inline Skill Editing
- Create Intervention Info
- Create Intervention Reports
- Cancel Tickets
- Cancel Appointments
- Clone Tickets
- Edit Ticket Details
- Edit Privat Notes
- Report Tickets
- Close Tickets
-
Admin Panel
-
FMA 2 App
-
Customer Portal
How to use the Forecasting Report
The predictive Forecasting component gives you far-reaching insights to take the right business decisions in advance.
It directly can assist you in the process of taking crucial business-changing actions.
What is the particular purpose of the Forecasting Report?
With the help of the Forecasting Report, you gain valuable insights regarding the distribution of dispatch groups and devices, development of work times, development of utilization, development of productivity, development of influencing factors, total ticket trends, and practical estimations for headcount developments and estimations for headcount developments with a configured productivity goal in mind.
You can form the base model to push the forecasting precision and experience even further.
Who benefits most from the Forecasting Report?
These person groups can benefit most from the Forecasting Report:
Managers, bosses, company leaders, HR, and long-term decision-takers.
The Forecasting Report is best suited to bosses and company leaders who keep track of general long-term business ongoings and who take major decisions (eg. operational decisions). With the Forecasting results they can go then to group managers, SDMs, etc., and tell them how to work with the results.
What is the difference between IN and OUT tabs?
The IN tabs display a statistical analysis of different parameters.
The OUT tabs build even more valuable forecasting data for your business with the help of prediction parameters and scores that are provided to the system (base model, target points). These parameters can easily be adjusted and configured inside the Fieldcode Admin Panel (coming later!) and take into consideration a lot of different influencing factors (eg. Annual Intervention Rate, Seasonal Variations, Lead Pipeline Intervention Rates, and other influencing factors).
How is the “Utilization” calculated?
Time spent on working (drive time + work time) compared to all available time in standard 8h working time.
How is the “Productivity” calculated?
Amount of points collected by engineer compared with productivity goal.
The productivity of a particular dispatch group is calculated with the help of the average productivity of its members.
Base model (IN)
The base model tab displays the productivity targets, the scoring system, and the business development:
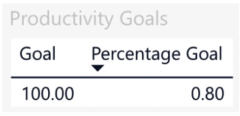
Target for engineers
- Every engineer should reach a hundred points working on tickets every day
- The overall productivity goal of a dispatch group is defined by 8% due to administrations and organizational overhead, absences, no-show, etc.
- Goals are customizable!
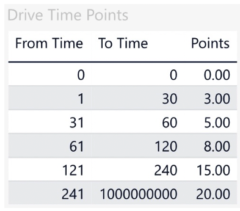
Travel zones
- Driving durations are a fundamental part of the productivity calculation
- Each travel zone is defined by minimal/maximal driving duration
- Travel zones are meant to be “one-way” as each route in Fieldcode is standing on its own. The method of operation is customizable.
- Additional travel zones can be added and points are subject to be adjusted.
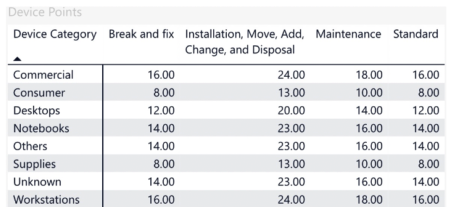
Point distribution
- Productivity is calculated based on points earned by the technician when working on tickets
- Points are subject to be defined for each device category an/or for every ticket category
- Changes are possible at any time and will be retroactively reflected in all calculations
Business indicators
- First thing to consider: Business development is not a constant.
- Business indicators are defined based on device category for a monthly period or dispatch group
- All values can be adjusted at any time in order to react to current developments
- Changes to the business indicators automatically trigger the recalculation and updating of the forecast
- The values always reflect a percentage for the change in intervention rate based on the respective category and as such will adjust the estimated baseline intervention rate
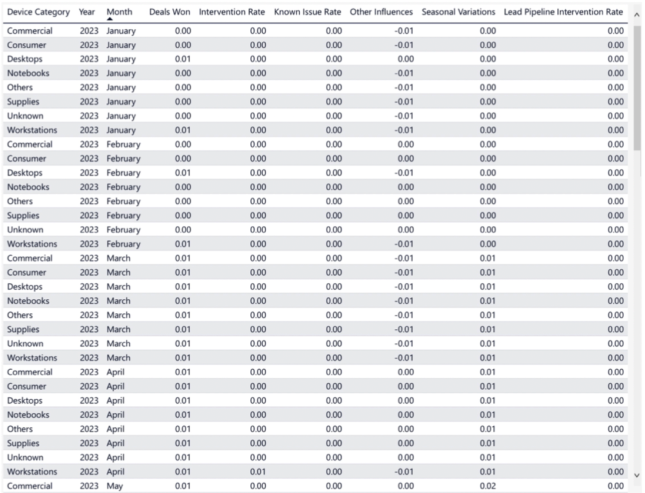
Business indicators - bullet points
The following below mentioned business indicator can be taken into consideration by default.
Business indicators can alternatively calculated dynamically using volume data for the individual indicators (based on AIR rate and installed base).
- Intervention rate (mandatory)
-> Baseline intervention rate (AIR=Annual Intervention rate) - Deals won (optional)
-> Percentage change in intervention rate due to deals won that have an impact in the estimation period (12 months window) - Lead pipeline intervention rate (optional)
-> Percentage change in intervention rate due to estimable lead pipeline conversions affecting the estimation period - Known issue rate (optional)
-> Percentage change in intervention rate caused by known issues, like e.g. defective parts, impacting the estimation period - Seasonal variations (optional)
-> Percentage change in the intervention rate caused by seasonal fluctuations, such as weather conditions, vacation times, etc. which have an impact during the estimation period - Other influences (optional)
-> Additional metric as percentage change in intervention rate to account for all other factors affecting the estimation period
Development Criteria (IN)
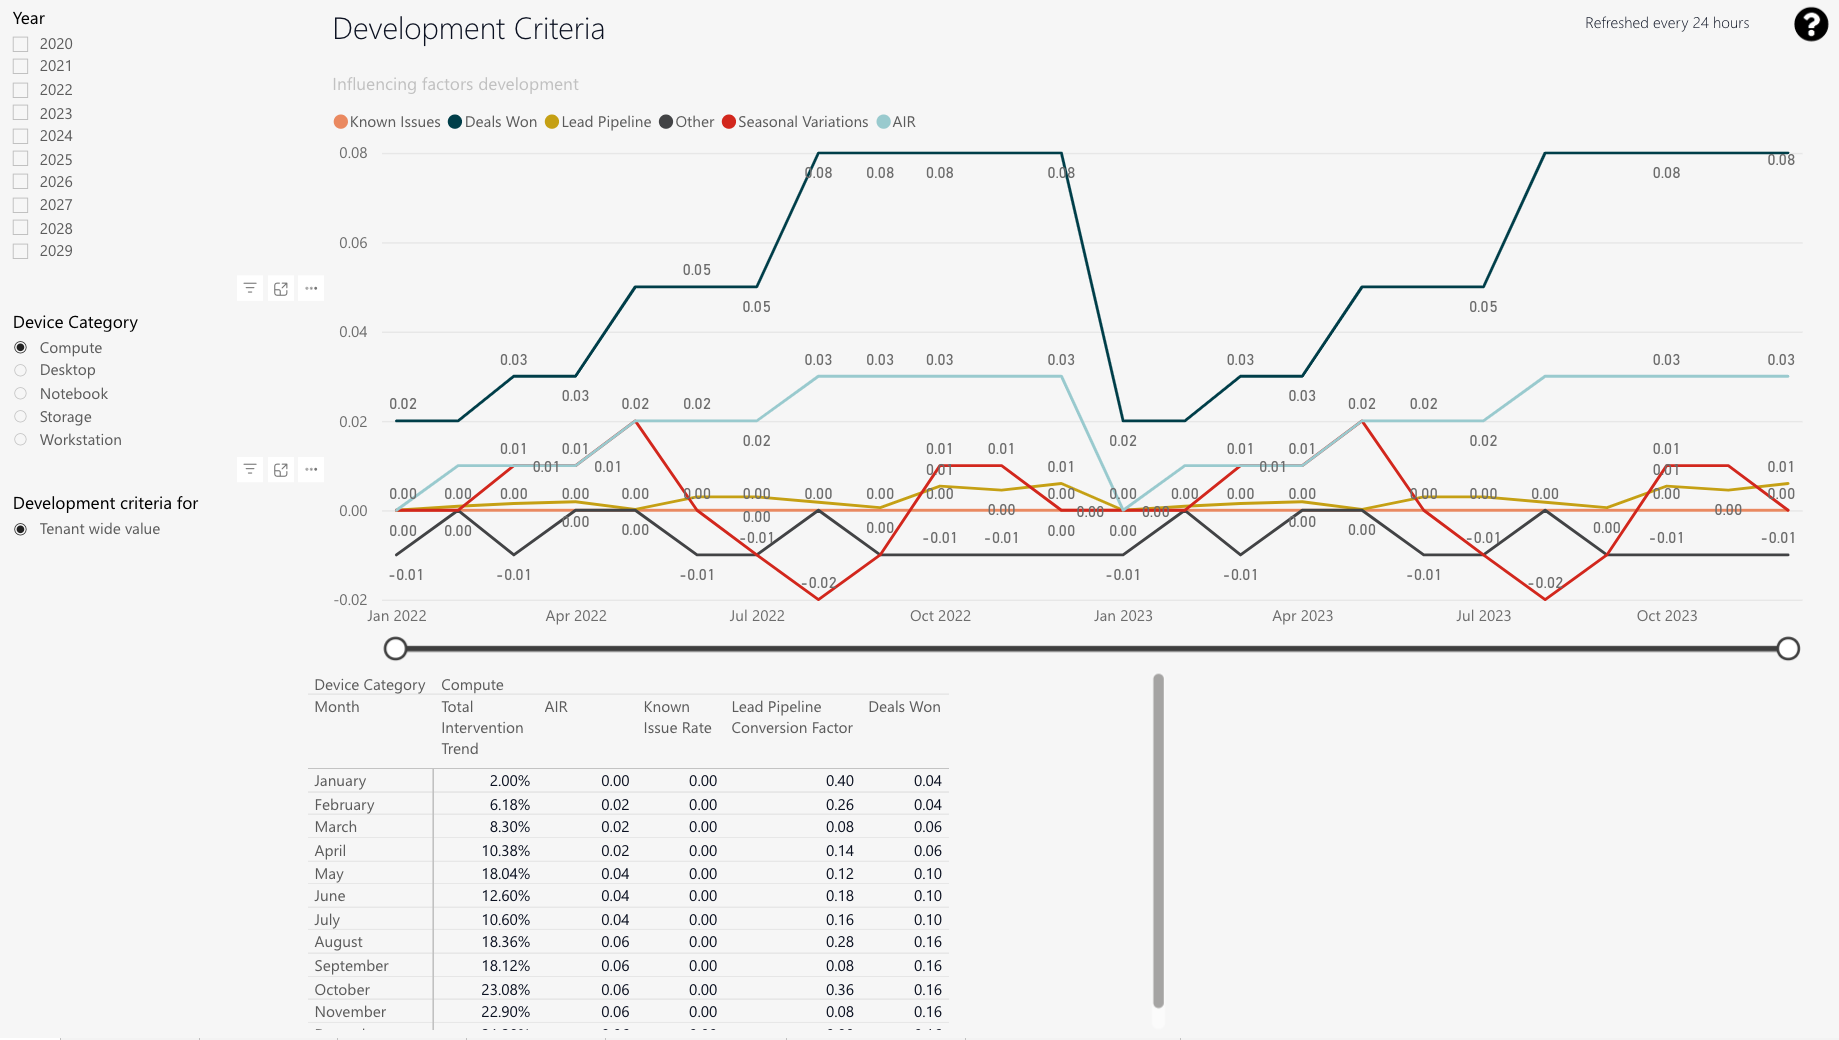
The development criteria tab displays you a forecast of influencing factors.
-
You can check upcoming influencing factors and check out how strong they will affect development.
You are able to configure the influencing factors, which are described under number 2. -
Deals Won; Lead Pipeline; Seasonal variations; Annual Intervention Rate (AIR); Other
-
Quarterly display with details on the individual criteria.
-
Year splicer
-
Device Category splicer
-
Development criteria for splicer
Distribution (IN)
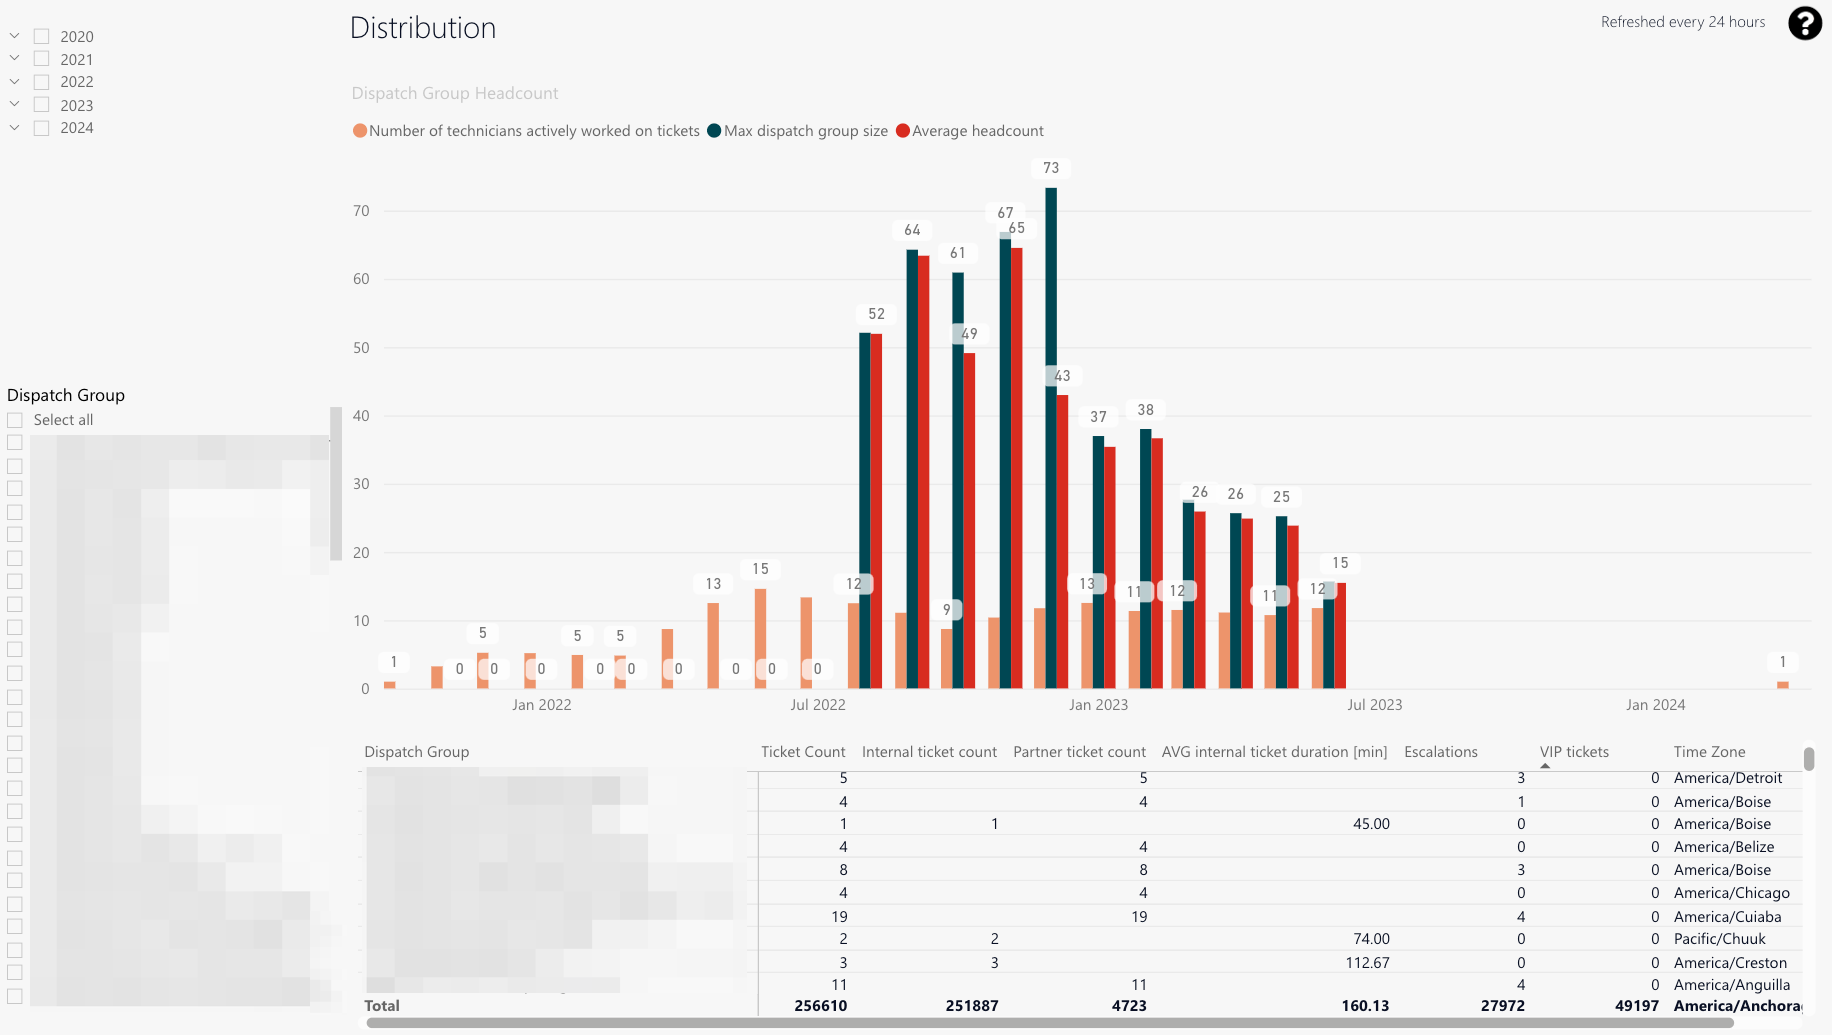
The distribution tab displays an overview of the current composition and development of various dispatch groups. It is also capable to display statistics of partners.
-
You can check your dispatch group headcount.
The different colored bars indicate different things, which are described under number 2. -
Orange: Engineers doing tickets (calculated average)
Dark green: Maximum dispatch group size
Red: Average headcount -
A detailed view displaying the described data points, which described under number 4.
-
Ticket count: Processed ticket amount of selected dispatch group for selected period.
Internal ticket count
Partner ticket count
Average internal ticket duration
Escalation and VIP count
Timezone where the selected dispatch group operates within -
Year splicer
-
Dispatch group splicer
Work Times (IN)
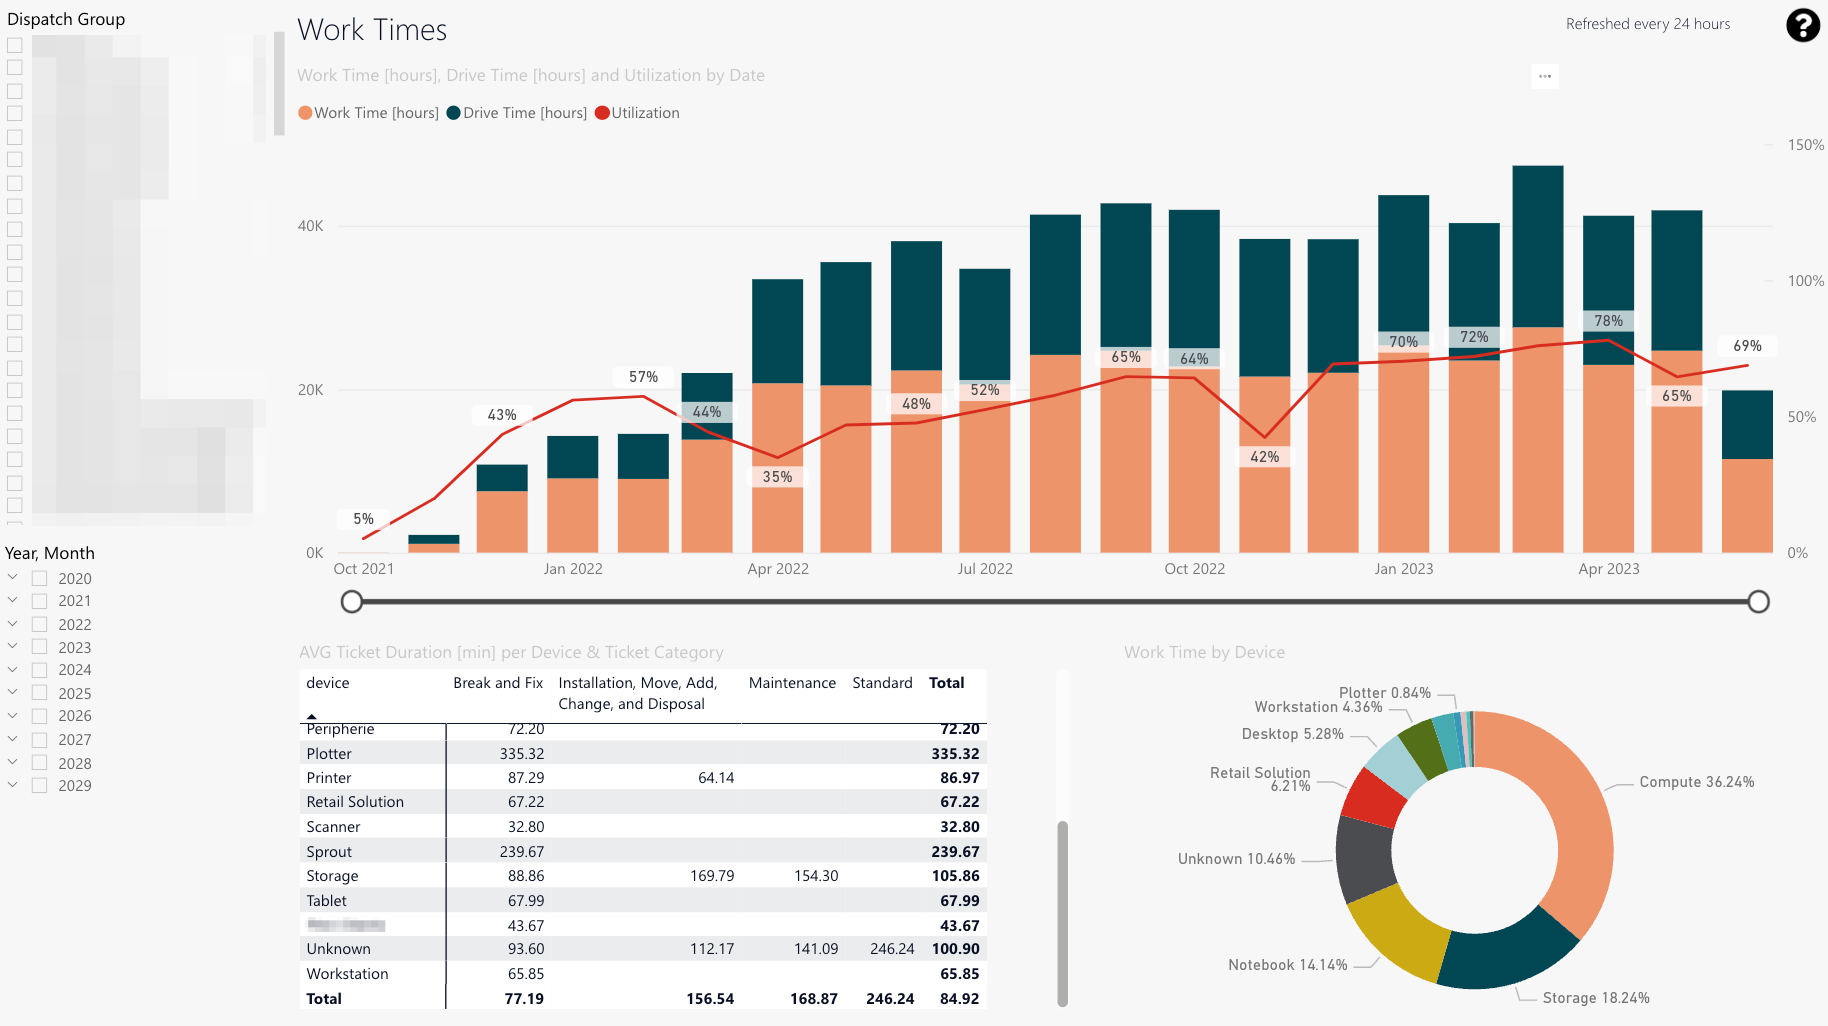
The work times tab displays insights on work time, drive time, and utilization by date:
-
The utilization line indicates the utilization trend in percent.
-
You can also check the engineer time spent on work compared to driving times (in hours) for each selected date individually.
-
Detail view displaying details on average work times (in minutes) per device & ticket category.
-
The work time separated by device (in percent).
-
Dispatch group splicer
-
Year/Month splicer
Utilization (IN)
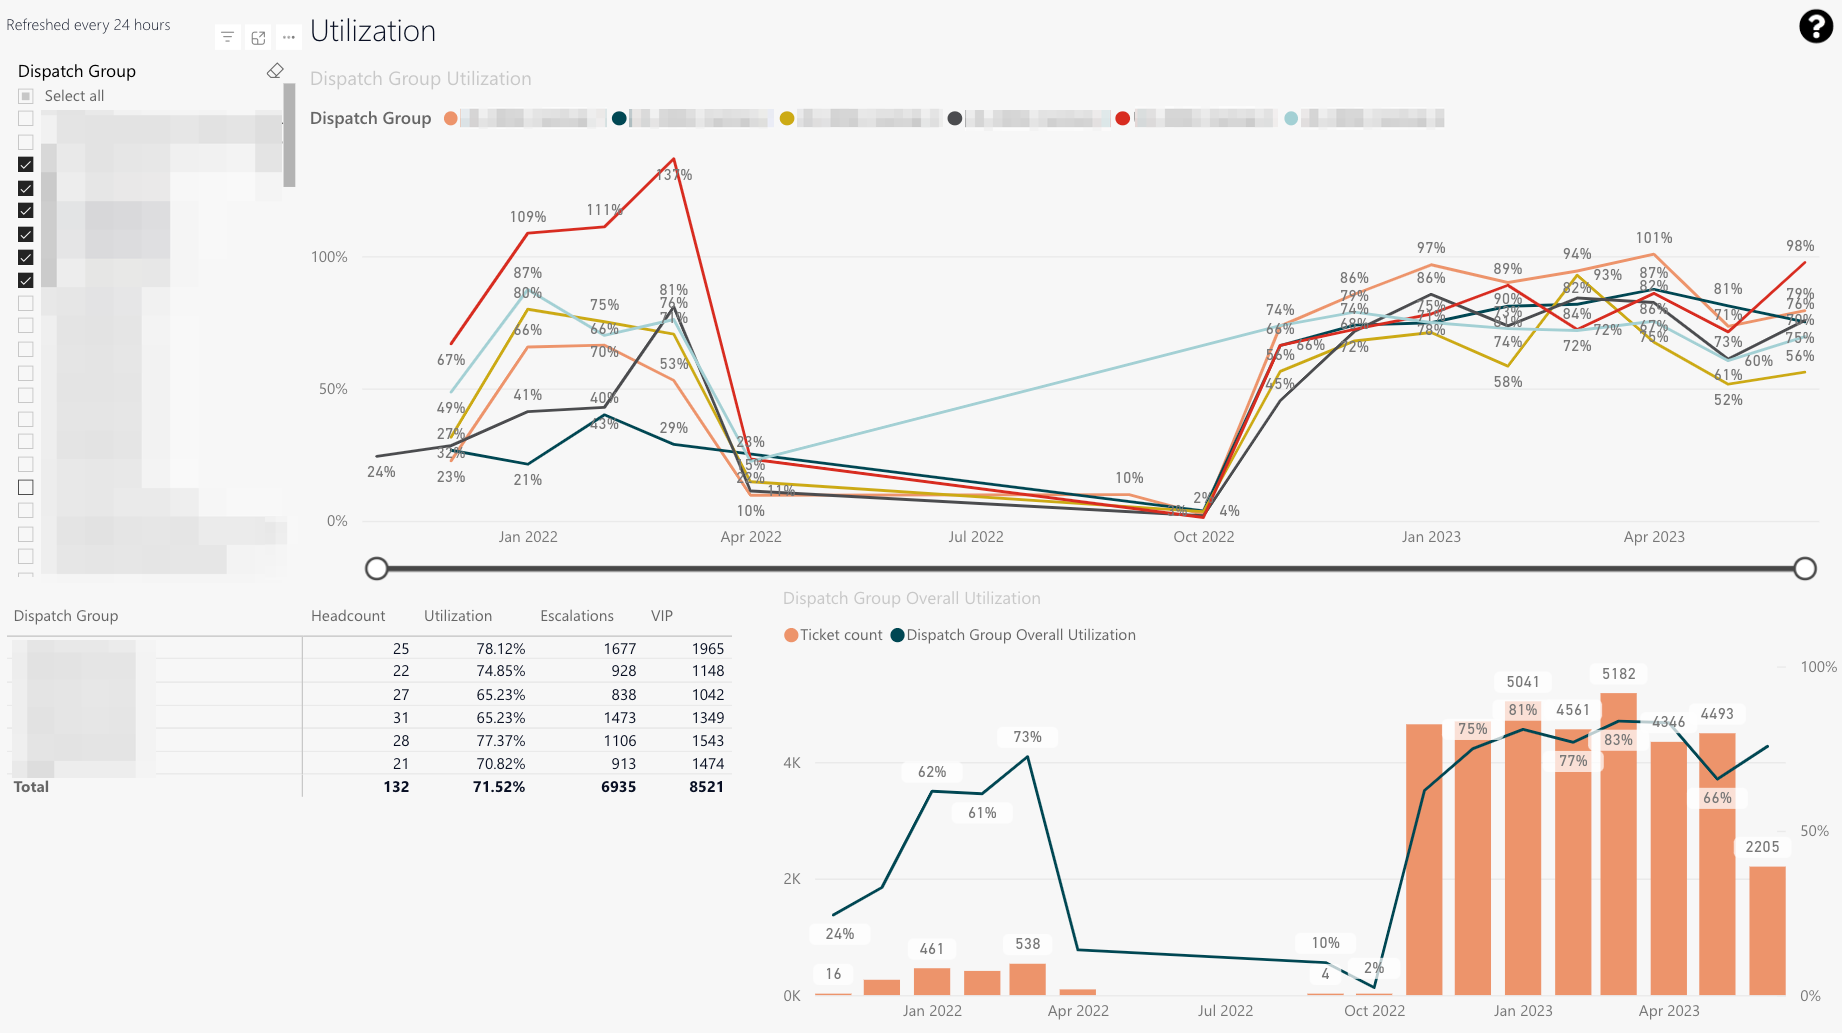
The utilization tab displays an time course of the utilization of dispatch groups:
-
The time spent working on tickets compared to contractual working hours (in percent).
-
This table displays the average number of technicians in a dispatch group (left), the average utilization of dispatch group (middle), and the count of escalations and VIP tickets (right).
-
This chart displays the overall utilization of selected dispatch groups compared to the ticket count.
-
Dispatch group splicer
Productivity (IN)
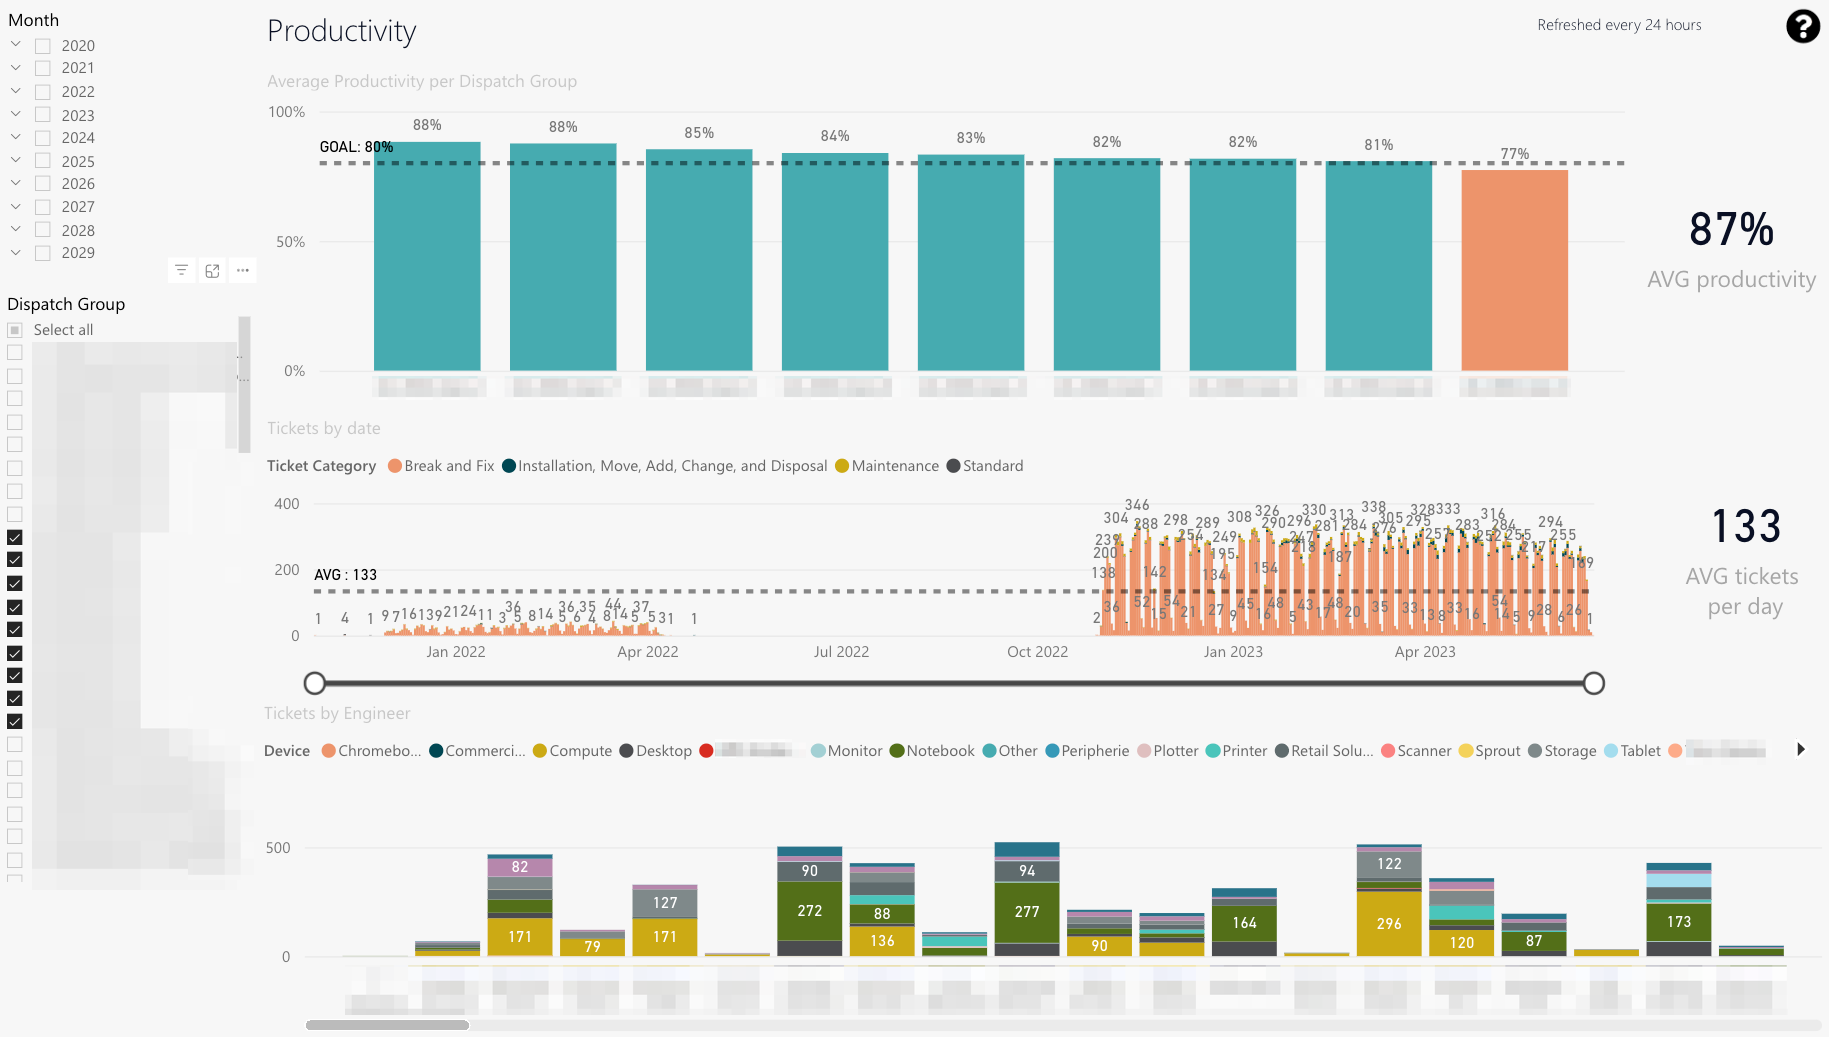
The productivity tab displays productivity indicators and the time course of dispatch groups and individual engineers:
-
Average productivity based on the device, the ticket category, and the travel zone of chosen dispatch group and time period.
-
Ticket category distribution for chosen dispatch groups.
-
Device distribution of engineers of chosen dispatch group and time period.
-
Year/Month splicer
-
Dispatch group splicer
Device Distribution (IN)
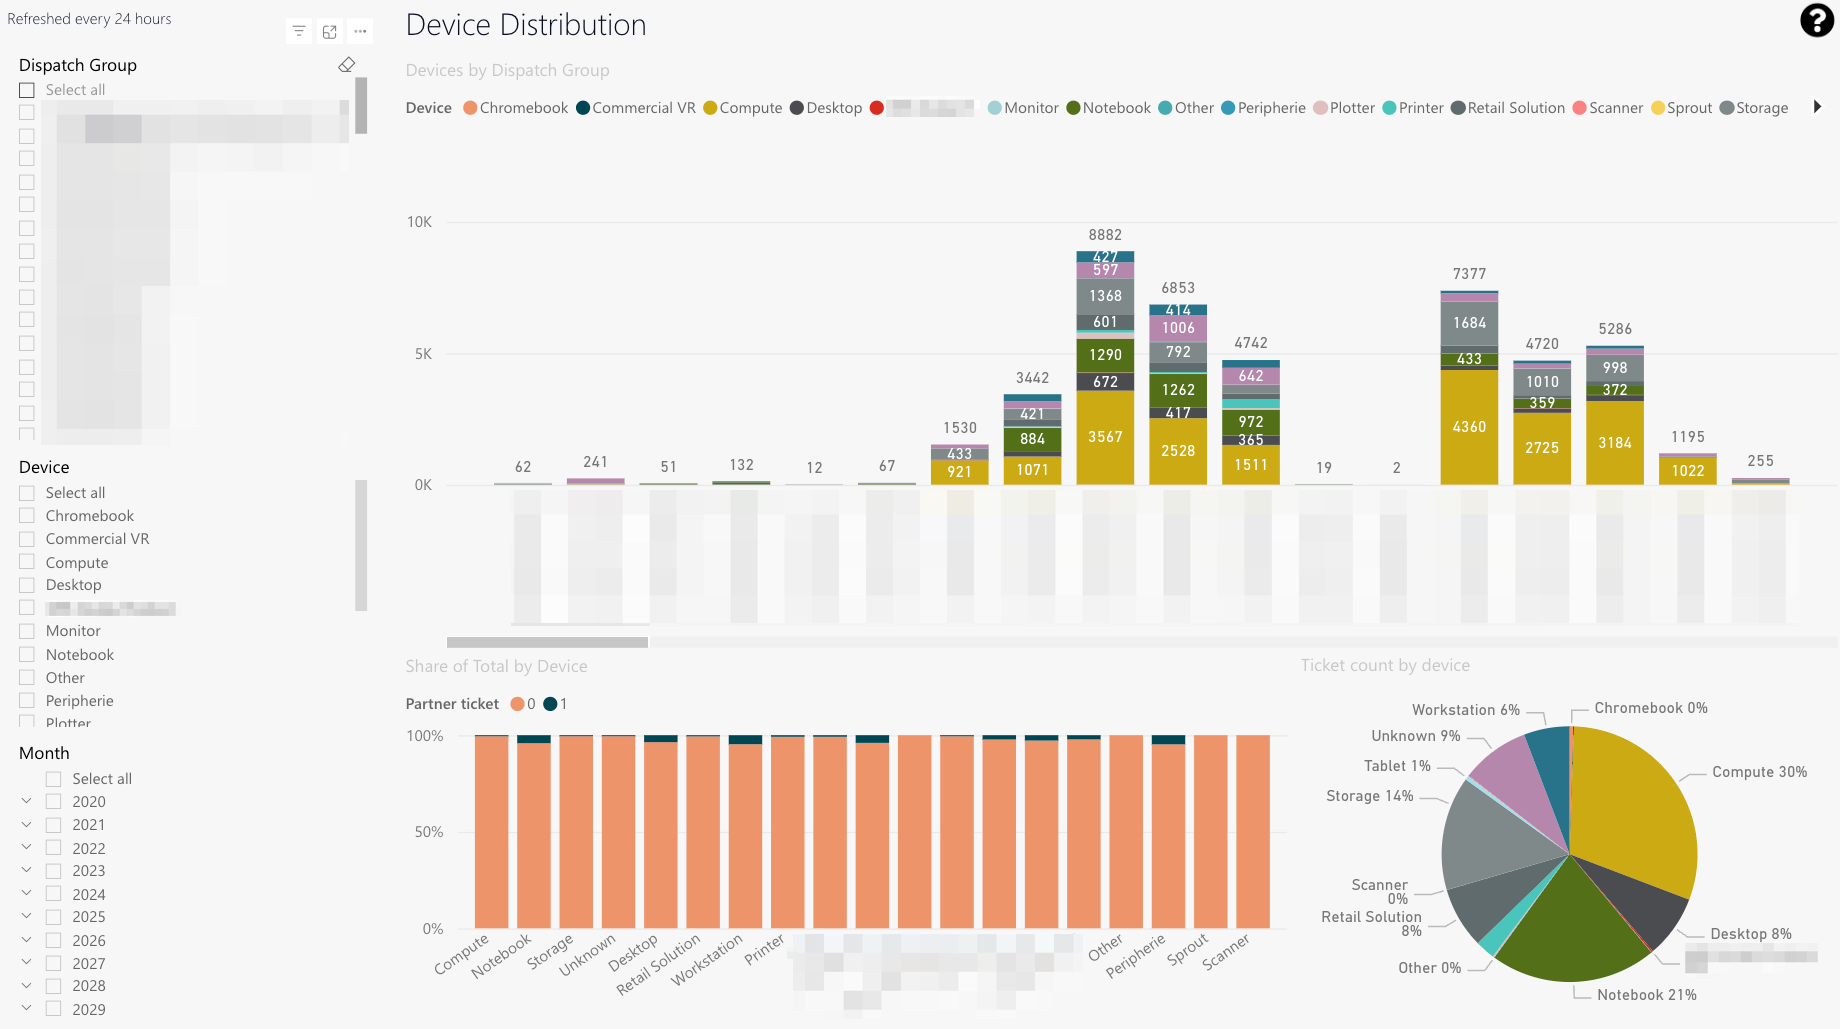
The device distribution tab displays the proportion of tickets per device category processed by the dispatch groups:
-
Count of tickets processed of each device category for the selected dispatch groups and the selected time period.
-
Share in percent compared to the total share of the selected dispatch group for each of the available device categories.
-
Ticket count in percent compared to the total ticket count for the selected dispatch group in each of the available device categories.
-
Dispatch group splicer
-
Device splicer
-
Year/Month splicer
Total ticket trend (OUT)
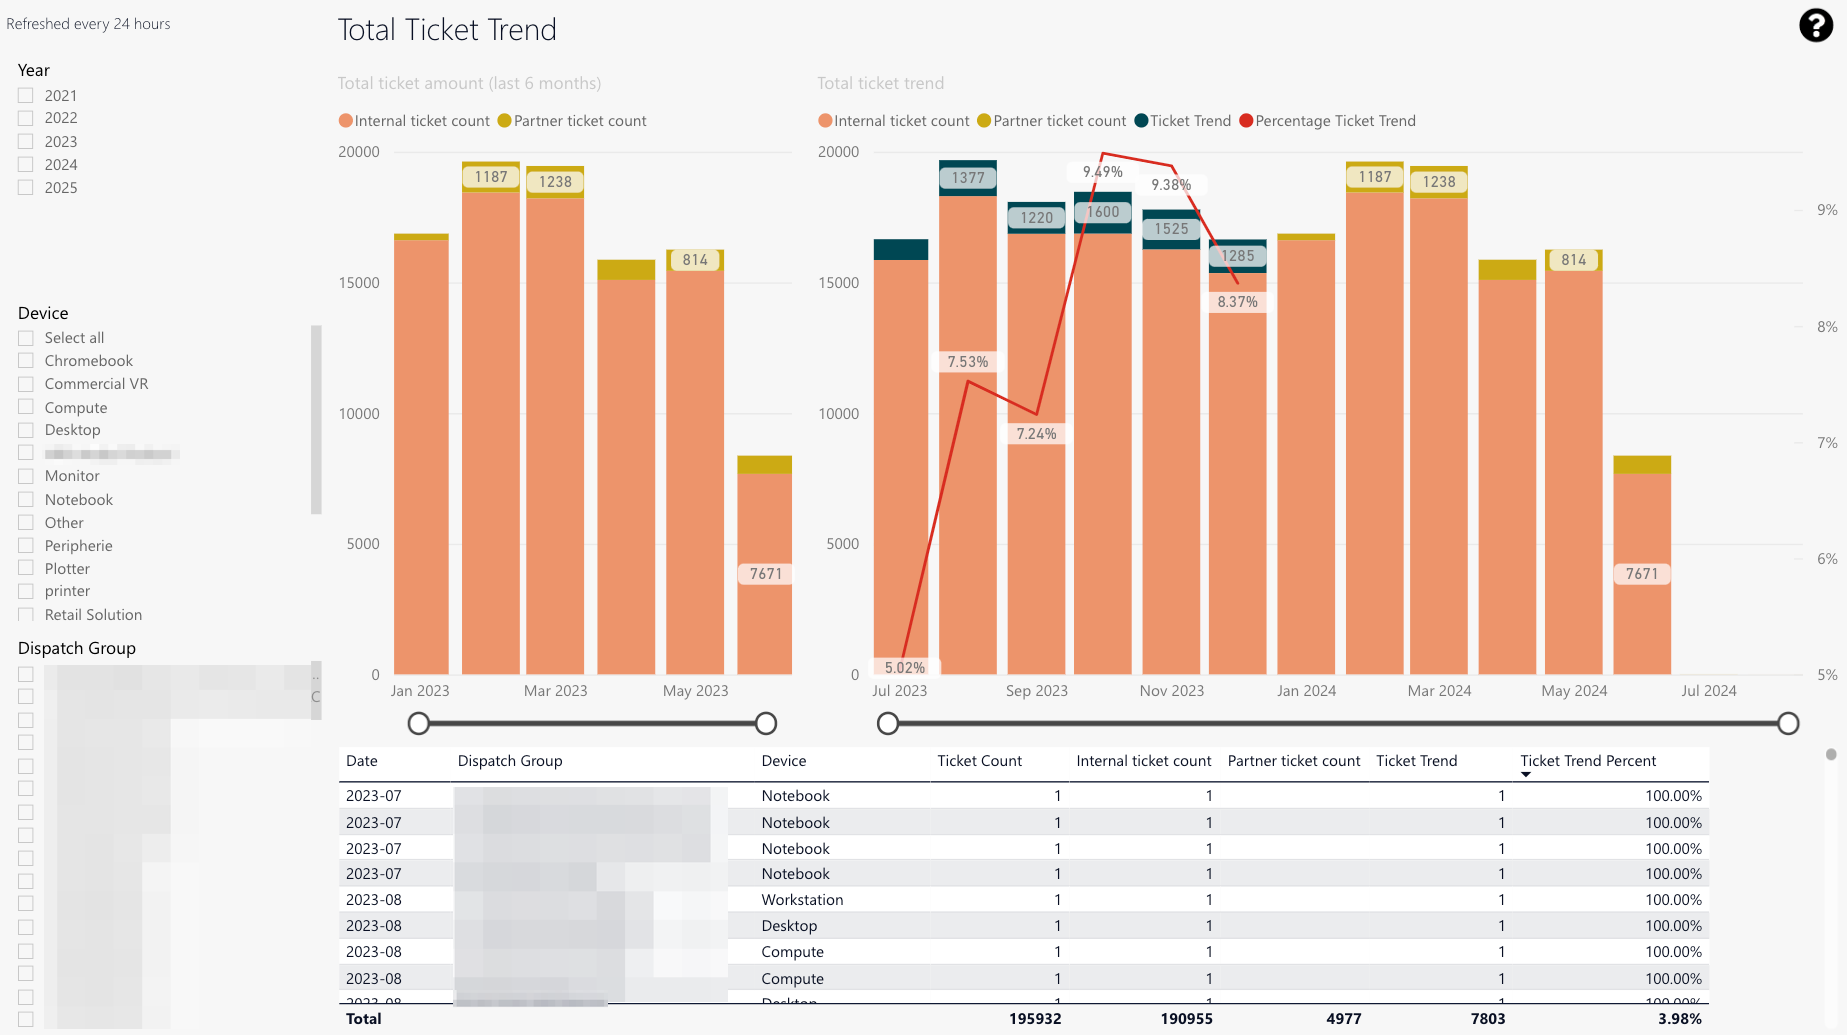
The total ticket trend tab assists in understanding general ticket trends (with partners included).
-
The last 6 months’ ticket count.
-
The total ticket trend in general (in percent).
-
The last years ticket count compared to the total.
-
The ticket count for particular dispatch groups, the ticket trend, and the total ticket trend in percent separated in detail by device and group in a number view.
-
Year splicer
-
Device splicer
-
Dispatch group splicer
Headcount forecast overview
-
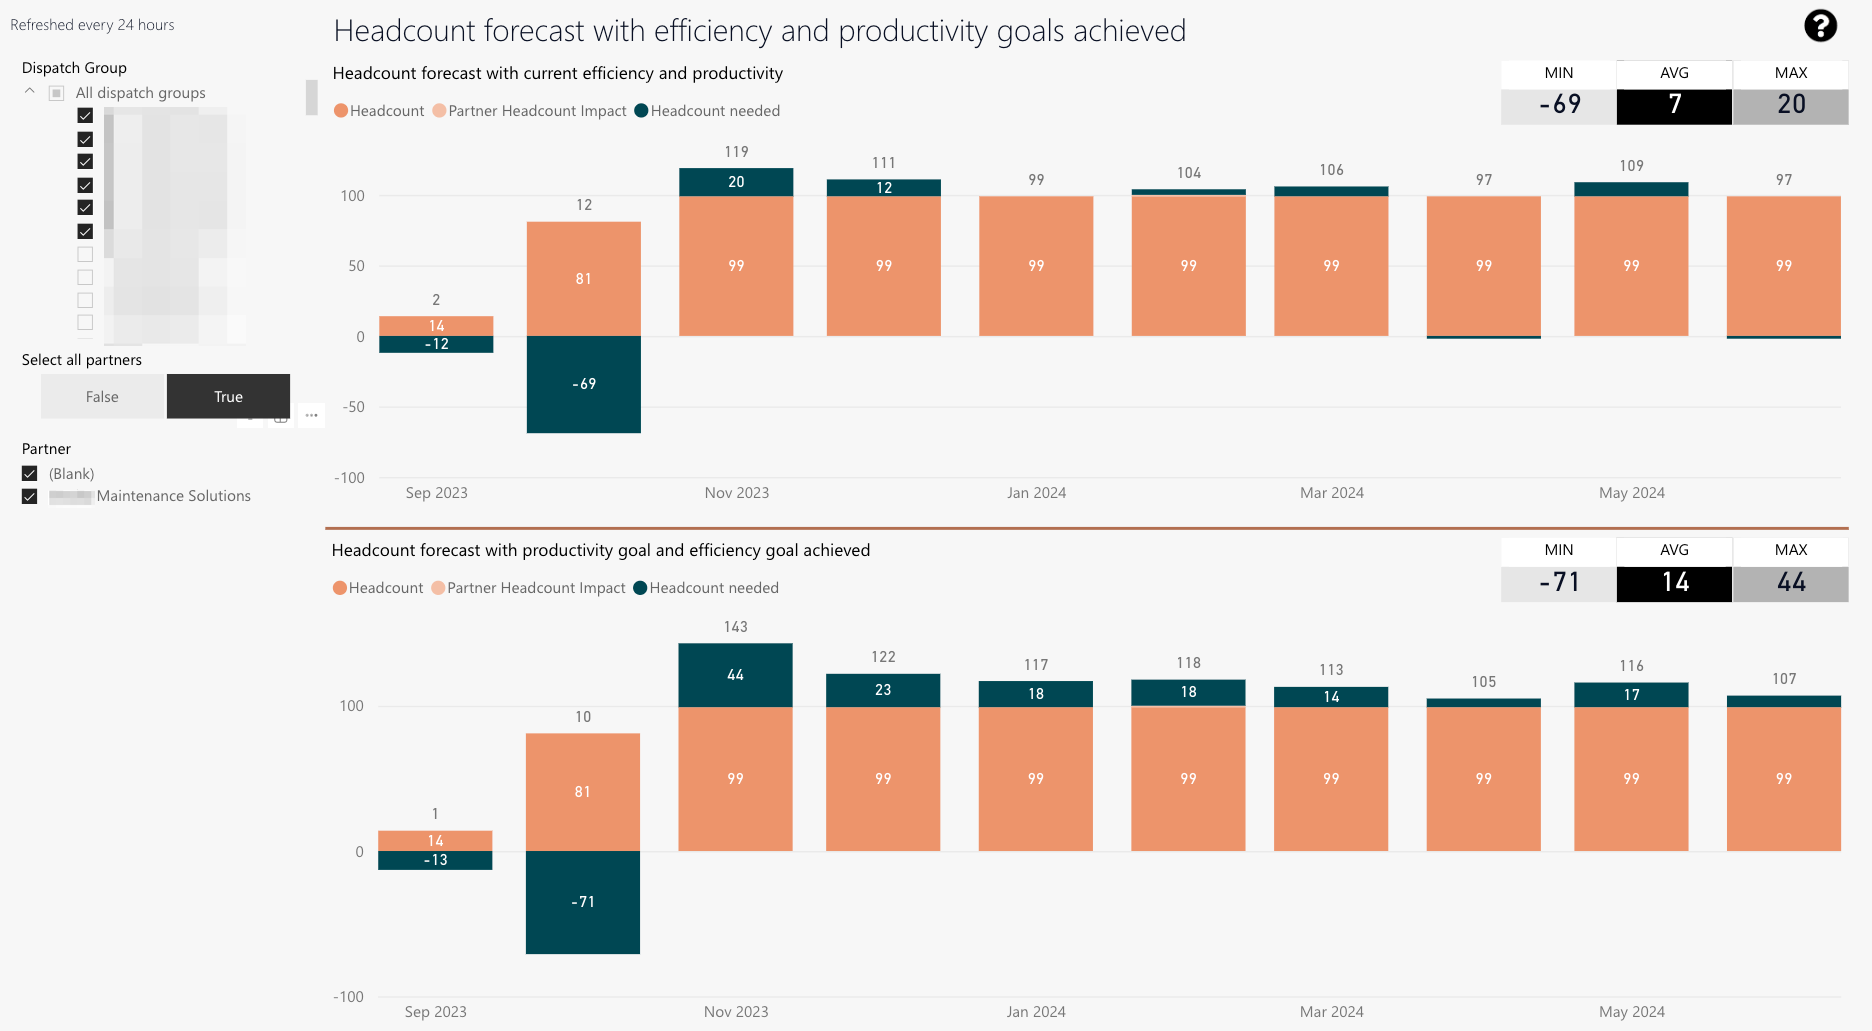
Headcount estimation based on current engineer counts while achieving current efficiency and productivity goals.
The partner headcount impact is also displayed. -
MIN: Minimum required engineers for the next 12 months to continue to maintain current productivity and efficiency.
AVG: On average required engineers for the next 12 months to continue to maintain current productivity and efficiency.
MAX: Maximum engineers for the next 12 months to continue to maintain current productivity and efficiency. -
Dispatch group splicer
-
The Select all partners toggle lets you select all partners for matching selected dispatch groups (context-based).
-
Partner splicer
Headcount forecast
-
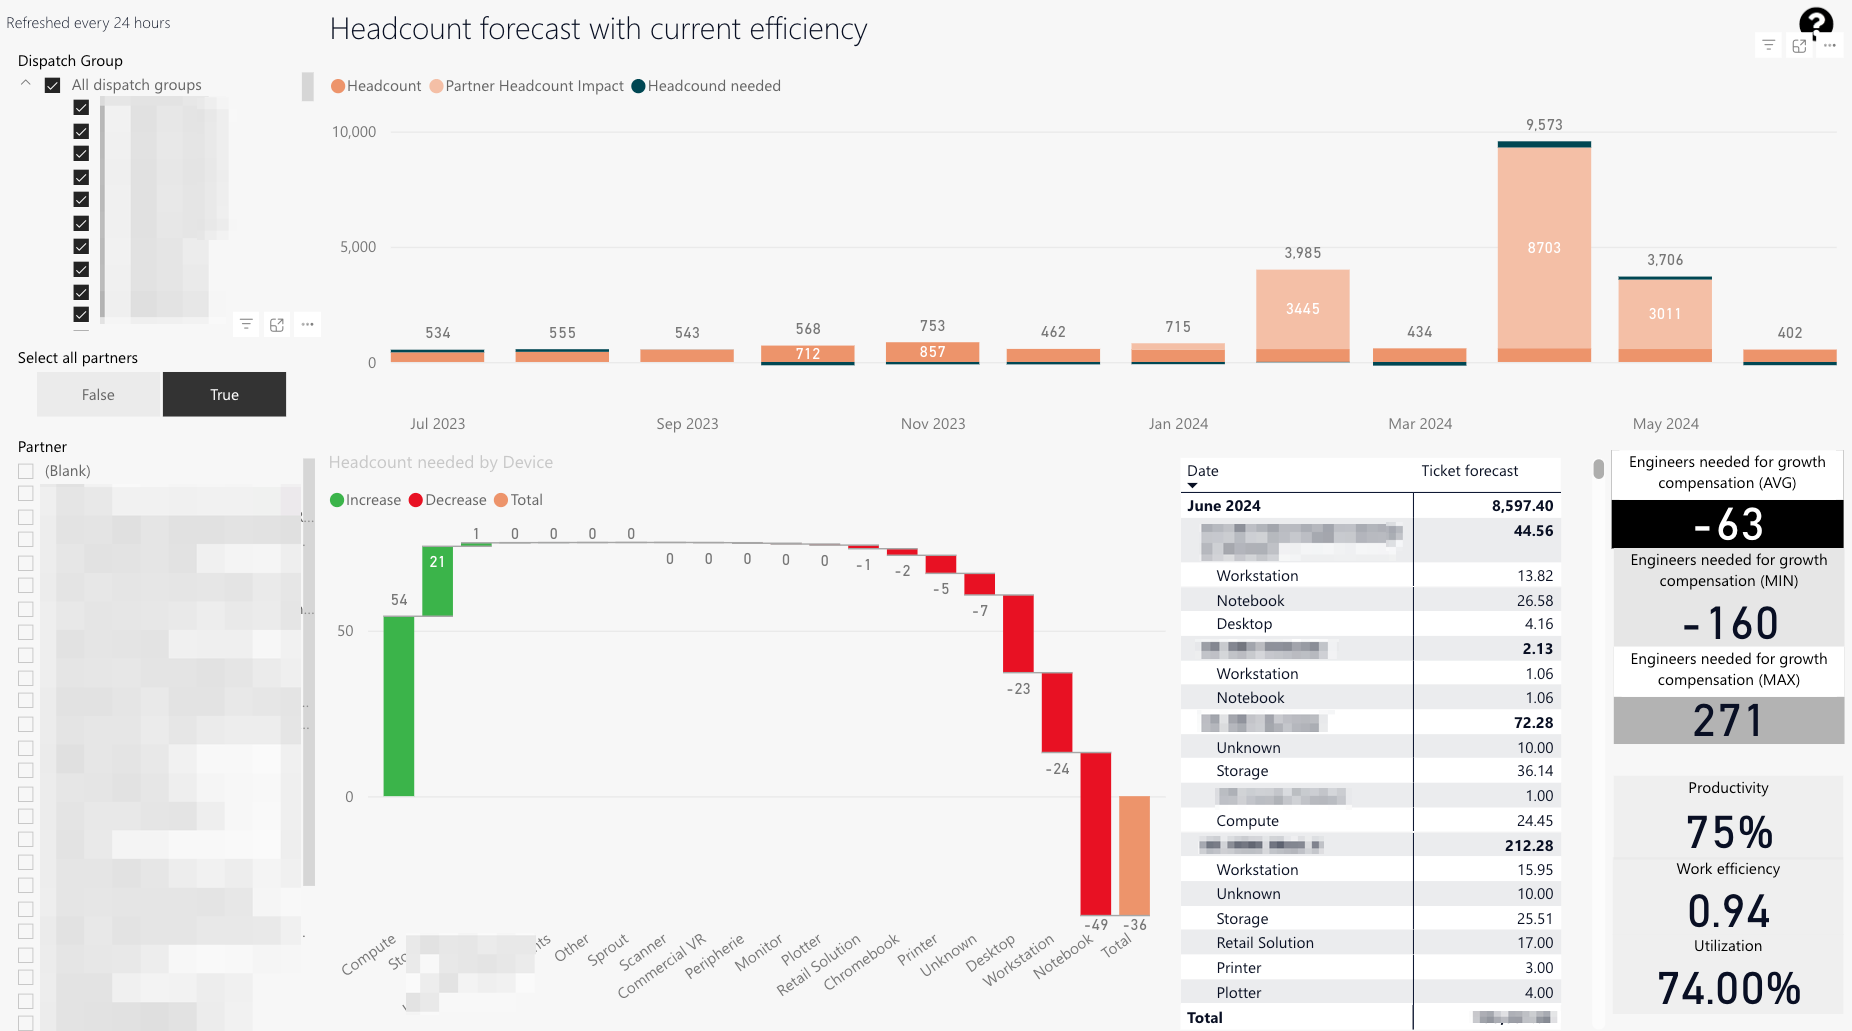
Headcount estimation based on current engineer count while achieving current efficiency and productivity goals.
The partner headcount impact is also displayed. -
Headcount required per device.
-
Ticket forecast per group and device.
-
MIN: Minimum required engineers for the next 12 months to continue to maintain current productivity and efficiency.
AVG: On average required engineers for the next 12 months to continue to maintain current productivity and efficiency.
MAX: Maximum engineers for the next 12 months to continue to maintain current productivity and efficiency. -
Current productivity
Work efficiency
Utilization -
Dispatch group splicer
-
The Select all partners toggle lets you select all partners for matching selected dispatch groups (context-based).
-
Partner splicer
5 out of 5 stars
1 rating
| 5 Stars | 100% | |
| 4 Stars | 0% | |
| 3 Stars | 0% | |
| 2 Stars | 0% | |
| 1 Stars | 0% |
