Tip: You can use filters for better results
-
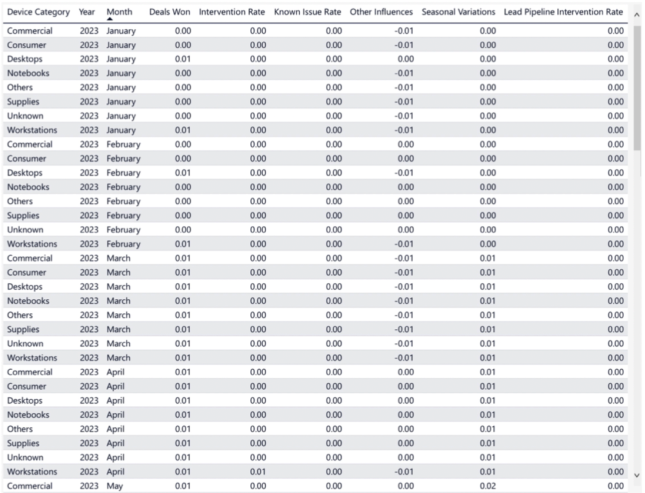
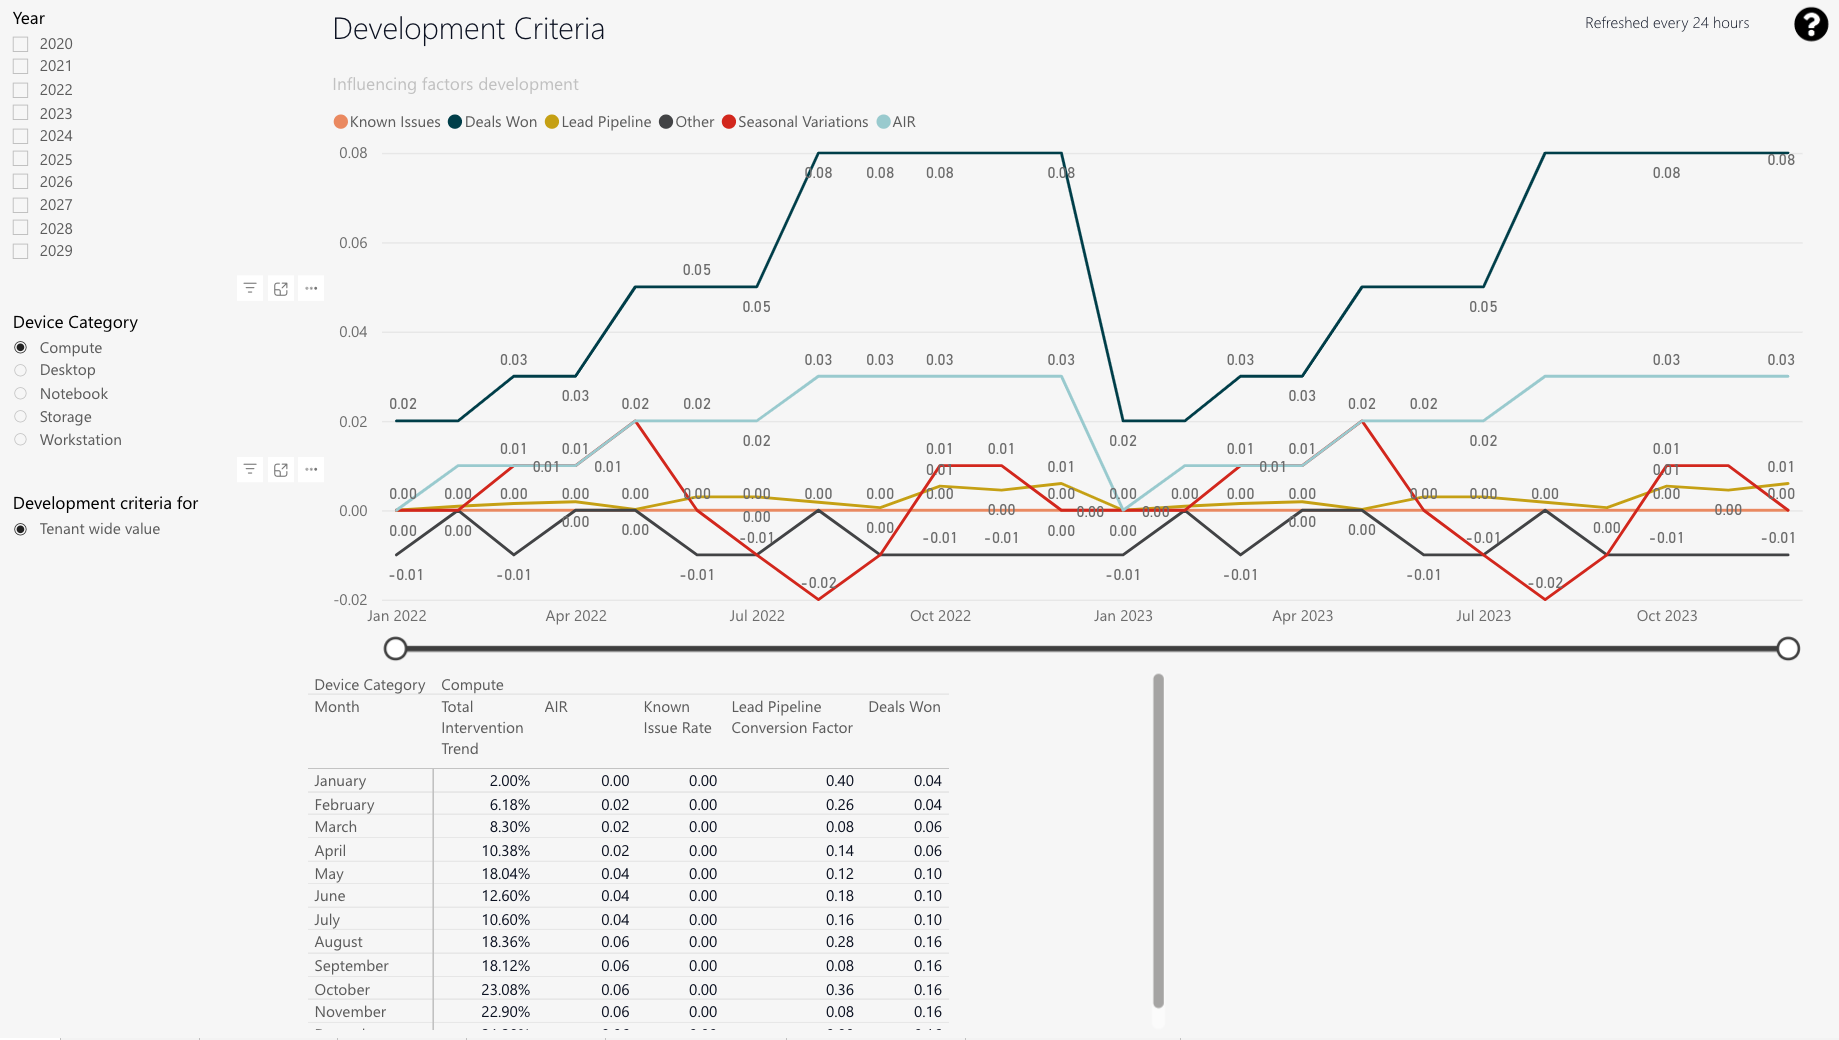
You can check upcoming influencing factors and check out how strong they will affect development.
You are able to configure the influencing factors, which are described under number 2. -
Deals Won; Lead Pipeline; Seasonal variations; Annual Intervention Rate (AIR); Other
-
Quarterly display with details on the individual criteria.
-
Year splicer
-
Device Category splicer
-
Development criteria for splicer
-
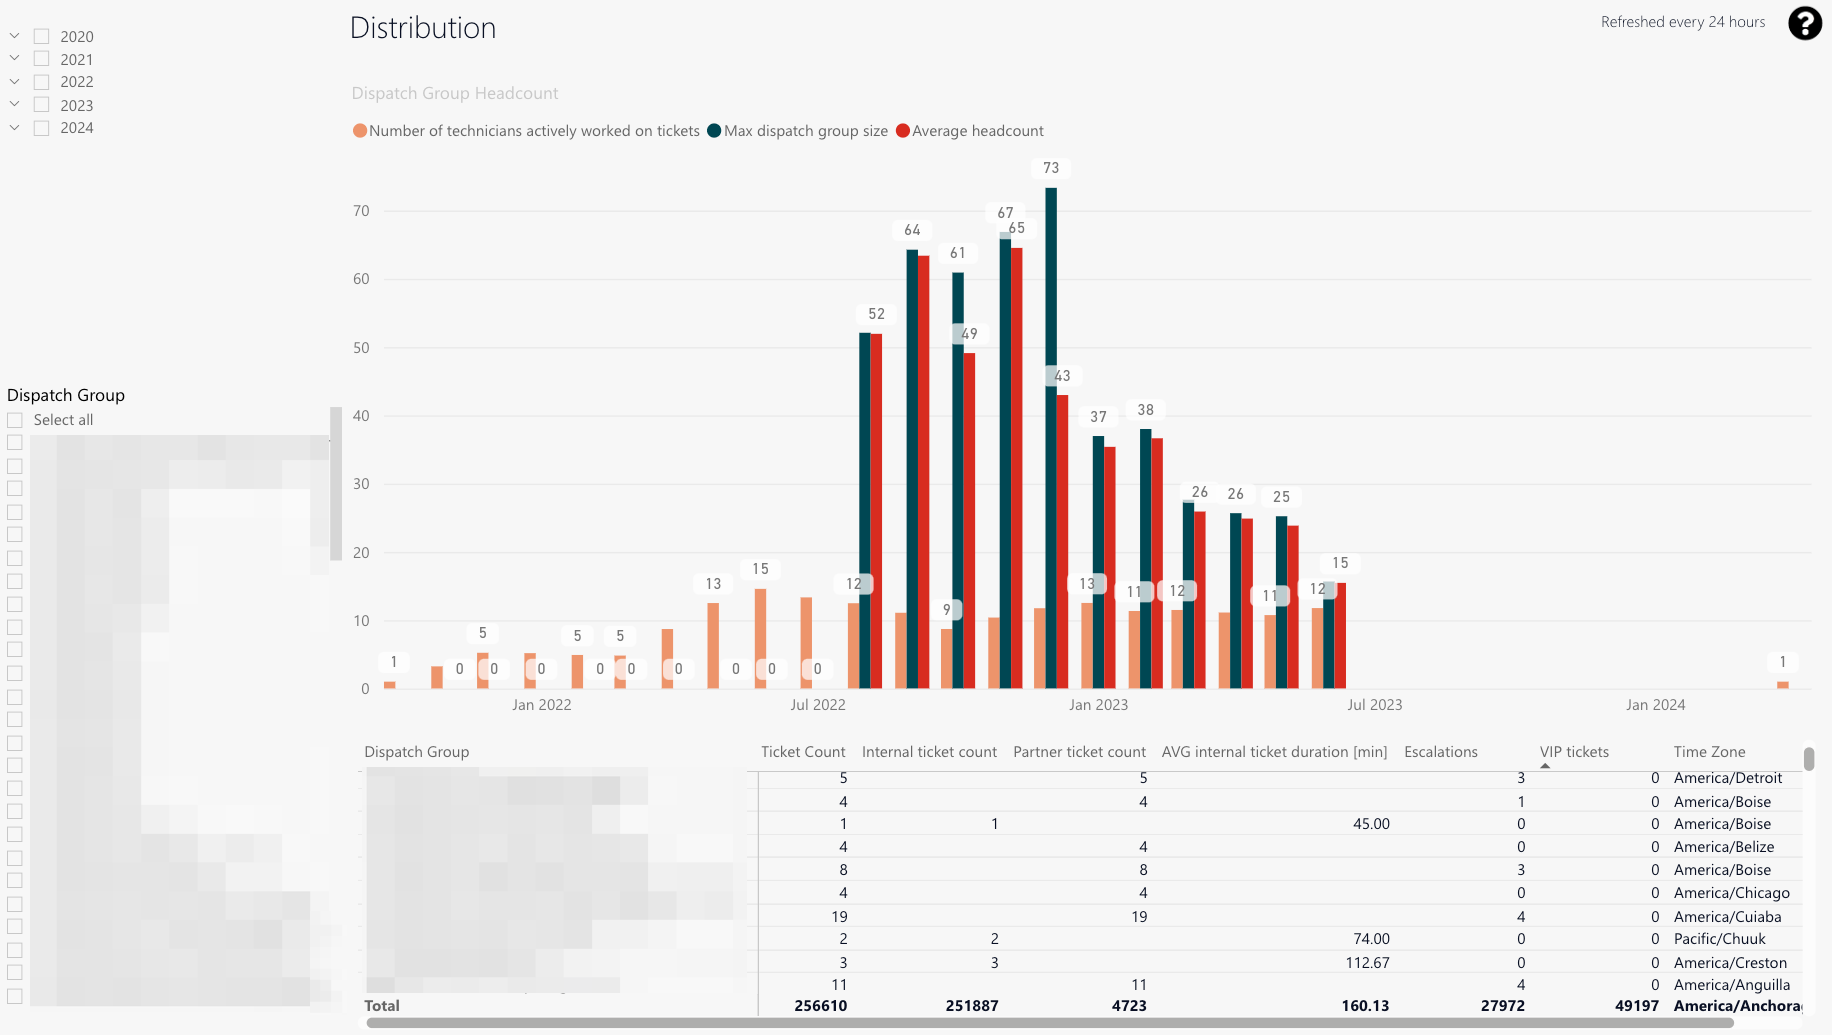
You can check your dispatch group headcount.
The different colored bars indicate different things, which are described under number 2. -
Orange: Engineers doing tickets (calculated average)
Dark green: Maximum dispatch group size
Red: Average headcount -
A detailed view displaying the described data points, which described under number 4.
-
Ticket count: Processed ticket amount of selected dispatch group for selected period.
Internal ticket count
Partner ticket count
Average internal ticket duration
Escalation and VIP count
Timezone where the selected dispatch group operates within -
Year splicer
-
Dispatch group splicer
-
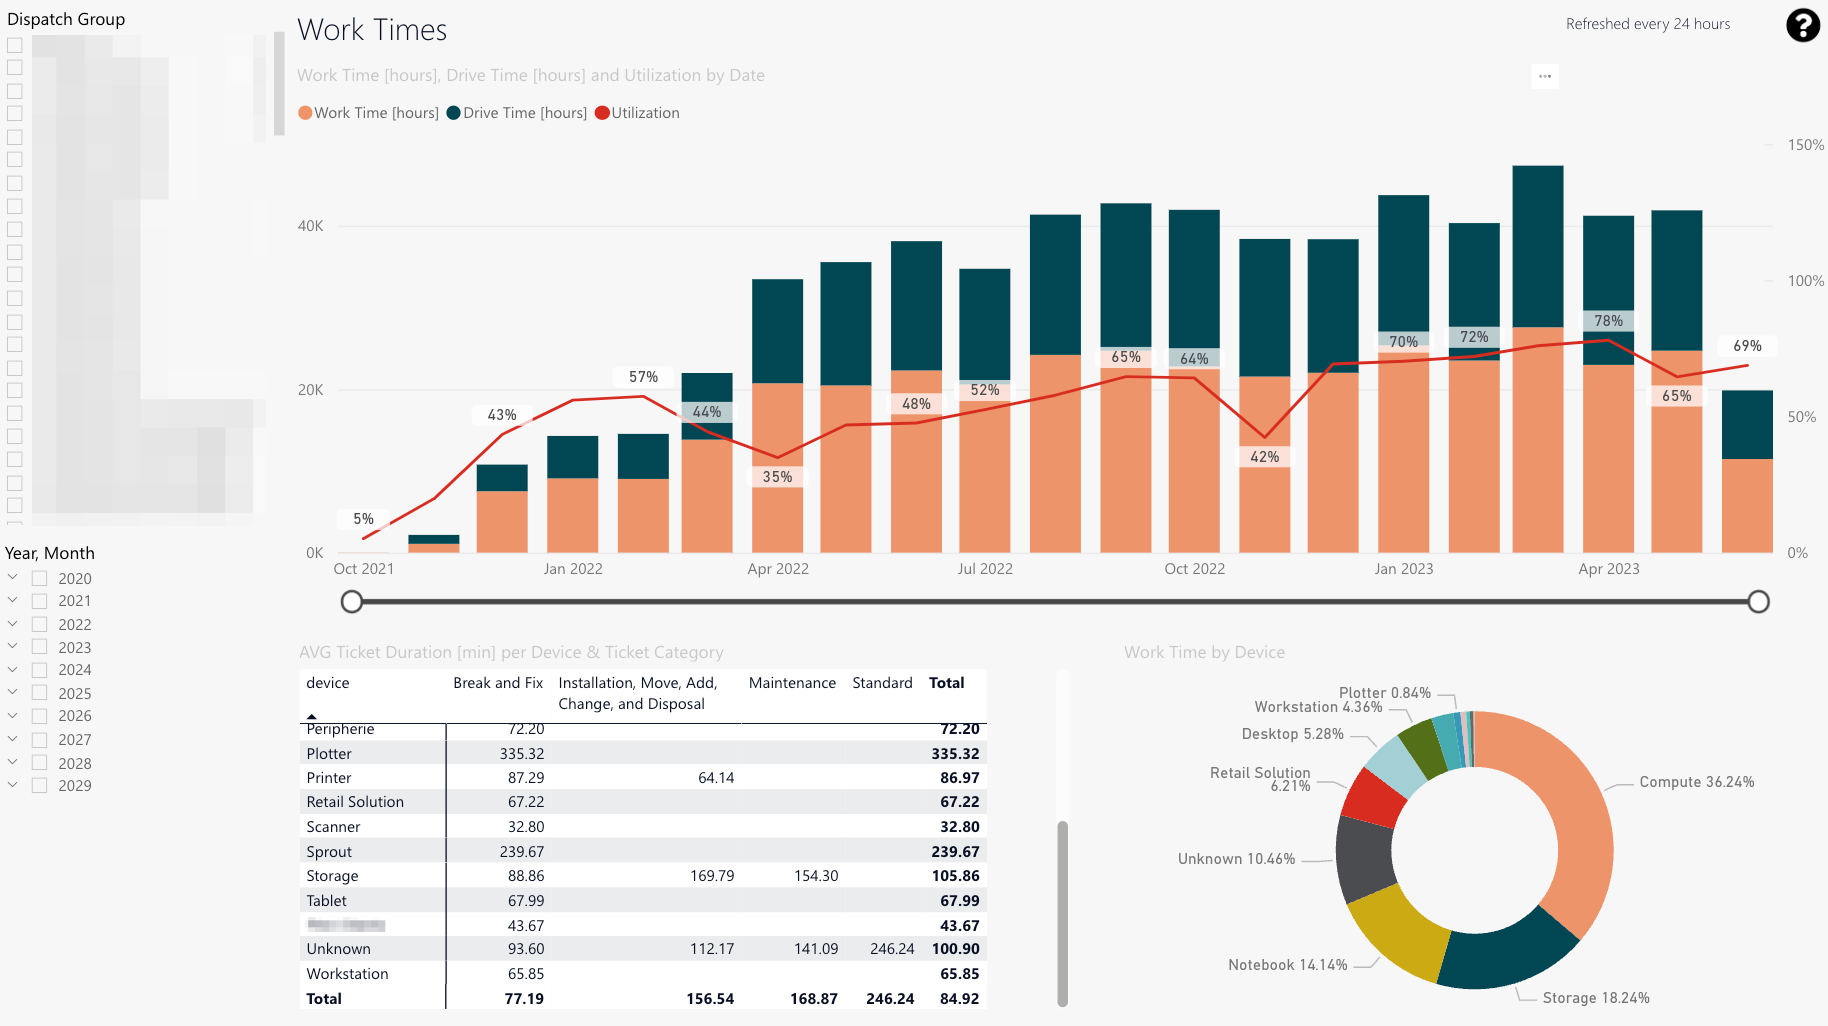
The utilization line indicates the utilization trend in percent.
-
You can also check the engineer time spent on work compared to driving times (in hours) for each selected date individually.
-
Detail view displaying details on average work times (in minutes) per device & ticket category.
-
The work time separated by device (in percent).
-
Dispatch group splicer
-
Year/Month splicer
-
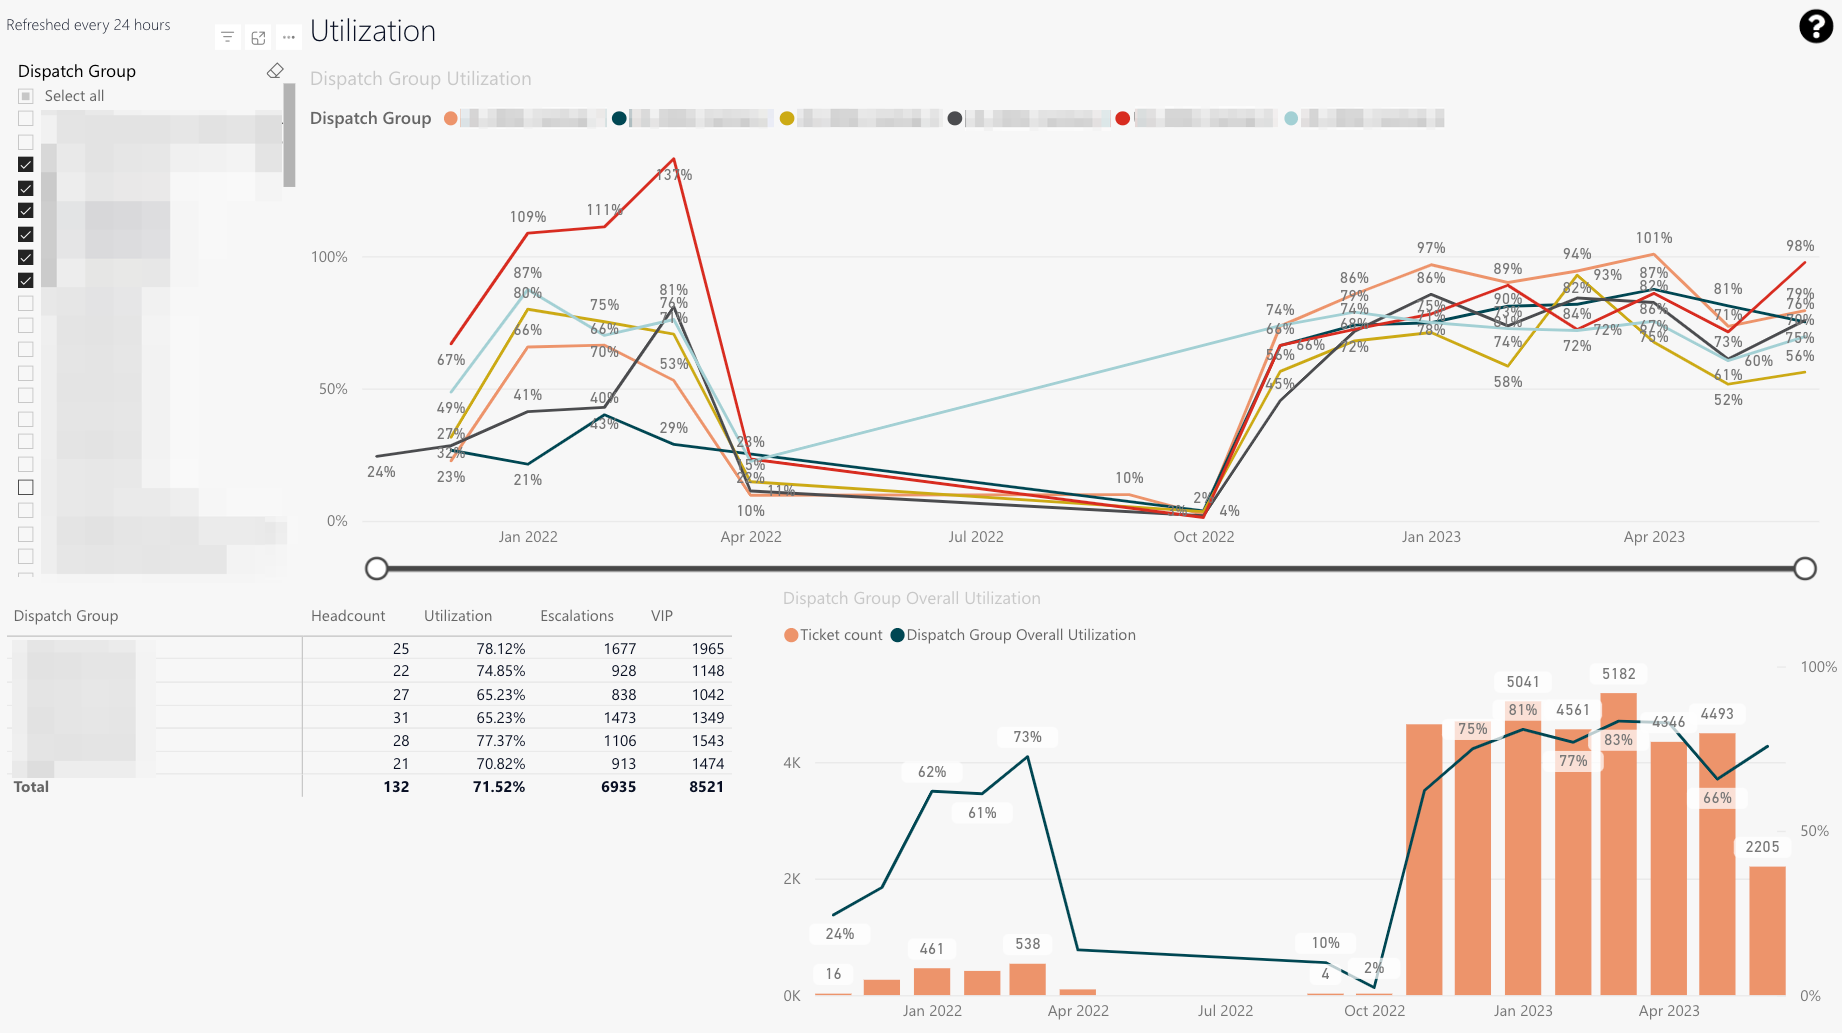
The time spent working on tickets compared to contractual working hours (in percent).
-
This table displays the average number of technicians in a dispatch group (left), the average utilization of dispatch group (middle), and the count of escalations and VIP tickets (right).
-
This chart displays the overall utilization of selected dispatch groups compared to the ticket count.
-
Dispatch group splicer
-
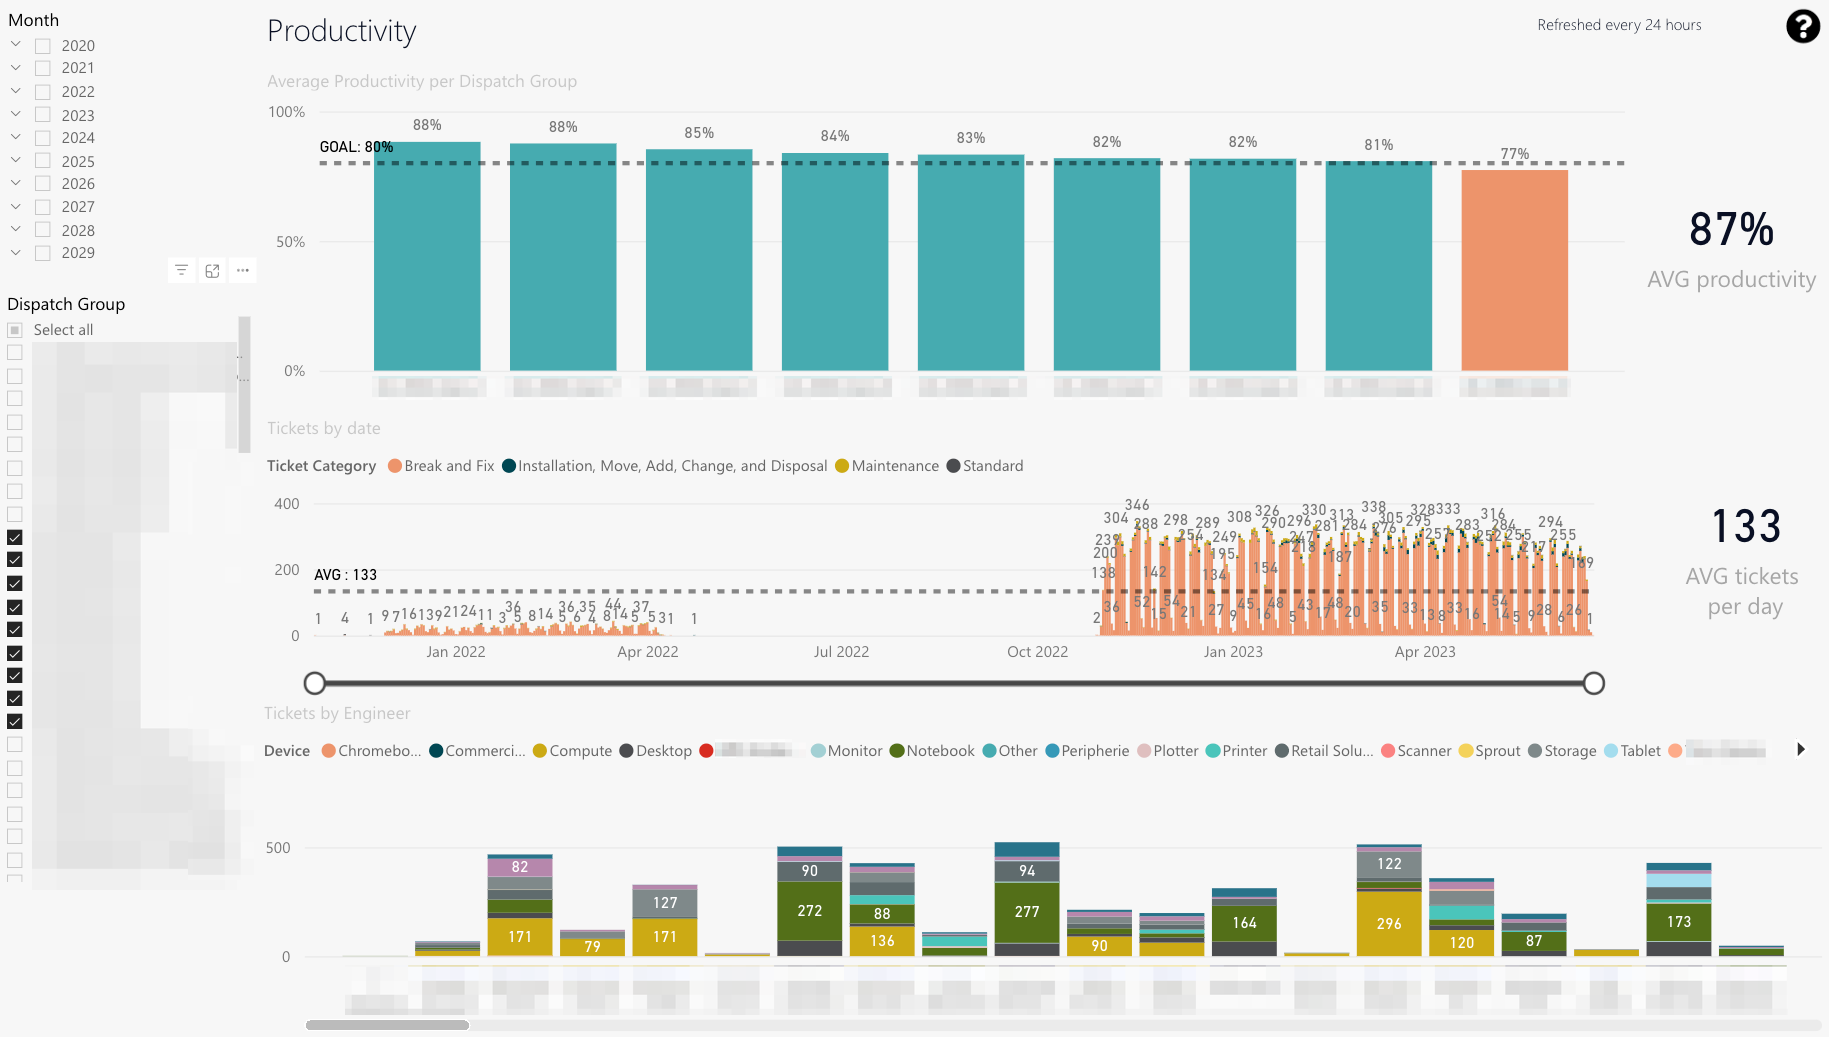
Average productivity based on the device, the ticket category, and the travel zone of chosen dispatch group and time period.
-
Ticket category distribution for chosen dispatch groups.
-
Device distribution of engineers of chosen dispatch group and time period.
-
Year/Month splicer
-
Dispatch group splicer
-
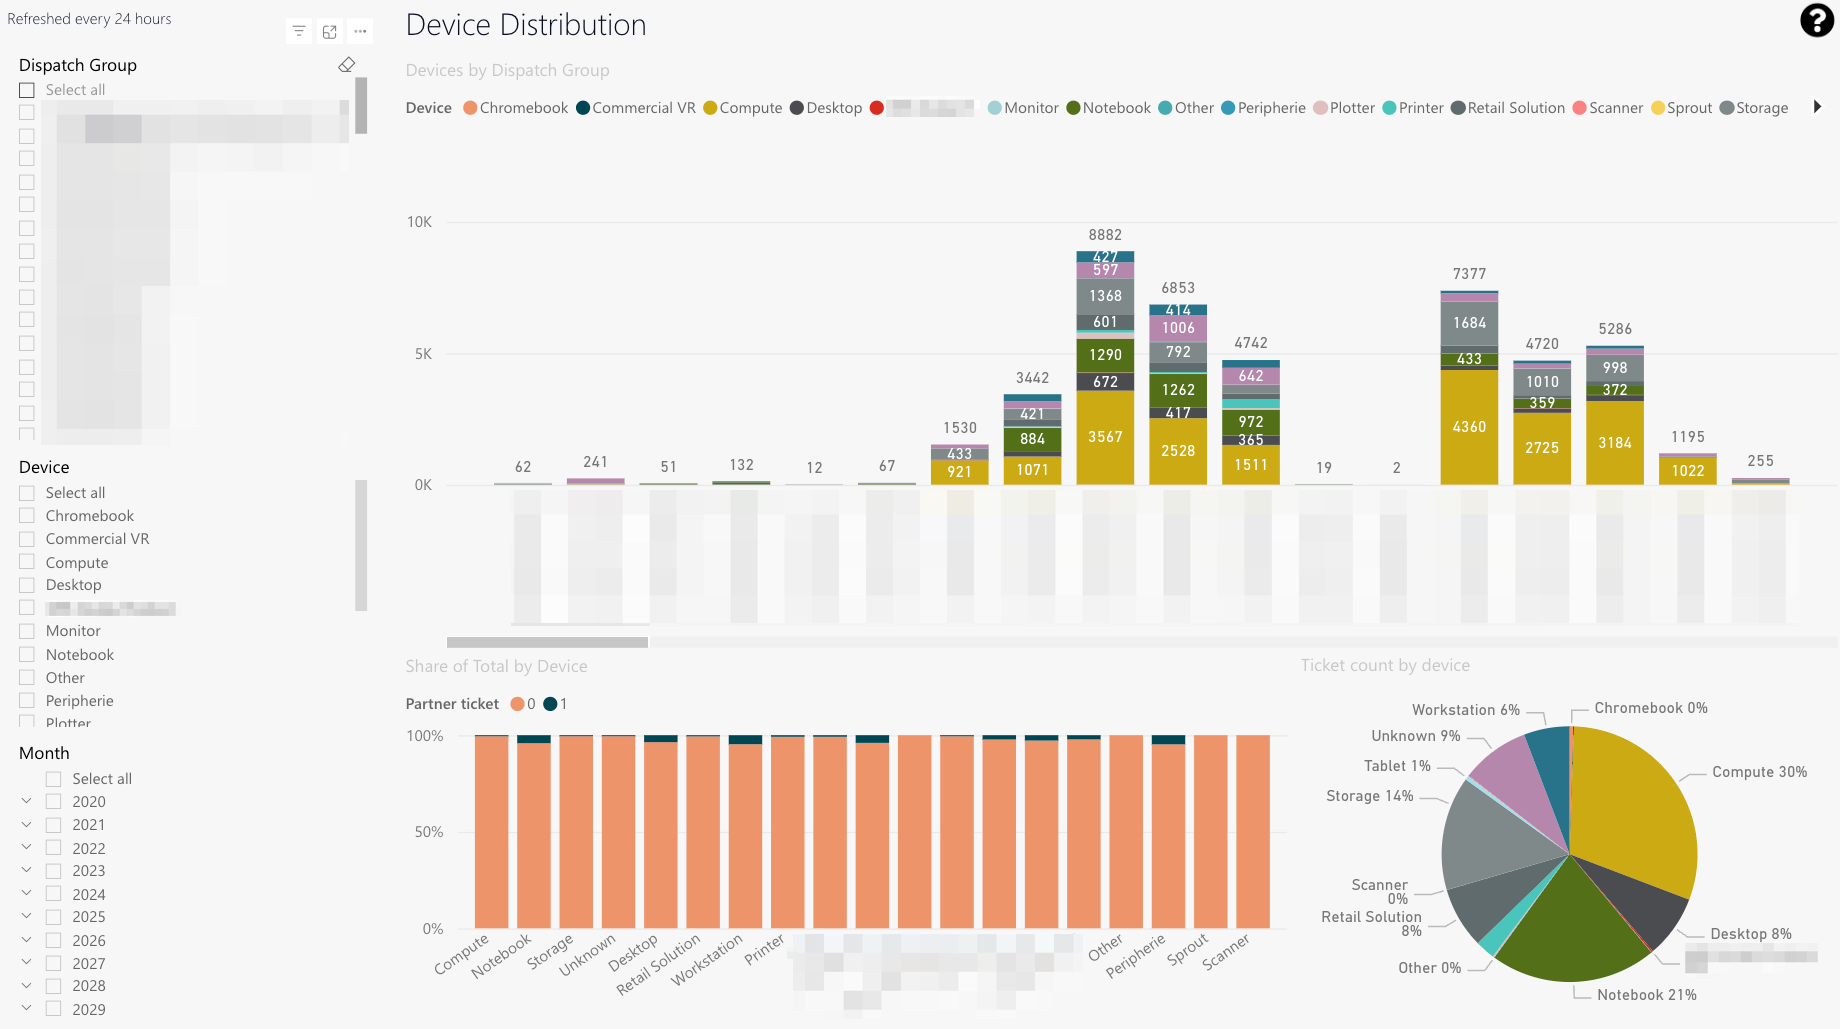
Count of tickets processed of each device category for the selected dispatch groups and the selected time period.
-
Share in percent compared to the total share of the selected dispatch group for each of the available device categories.
-
Ticket count in percent compared to the total ticket count for the selected dispatch group in each of the available device categories.
-
Dispatch group splicer
-
Device splicer
-
Year/Month splicer
-
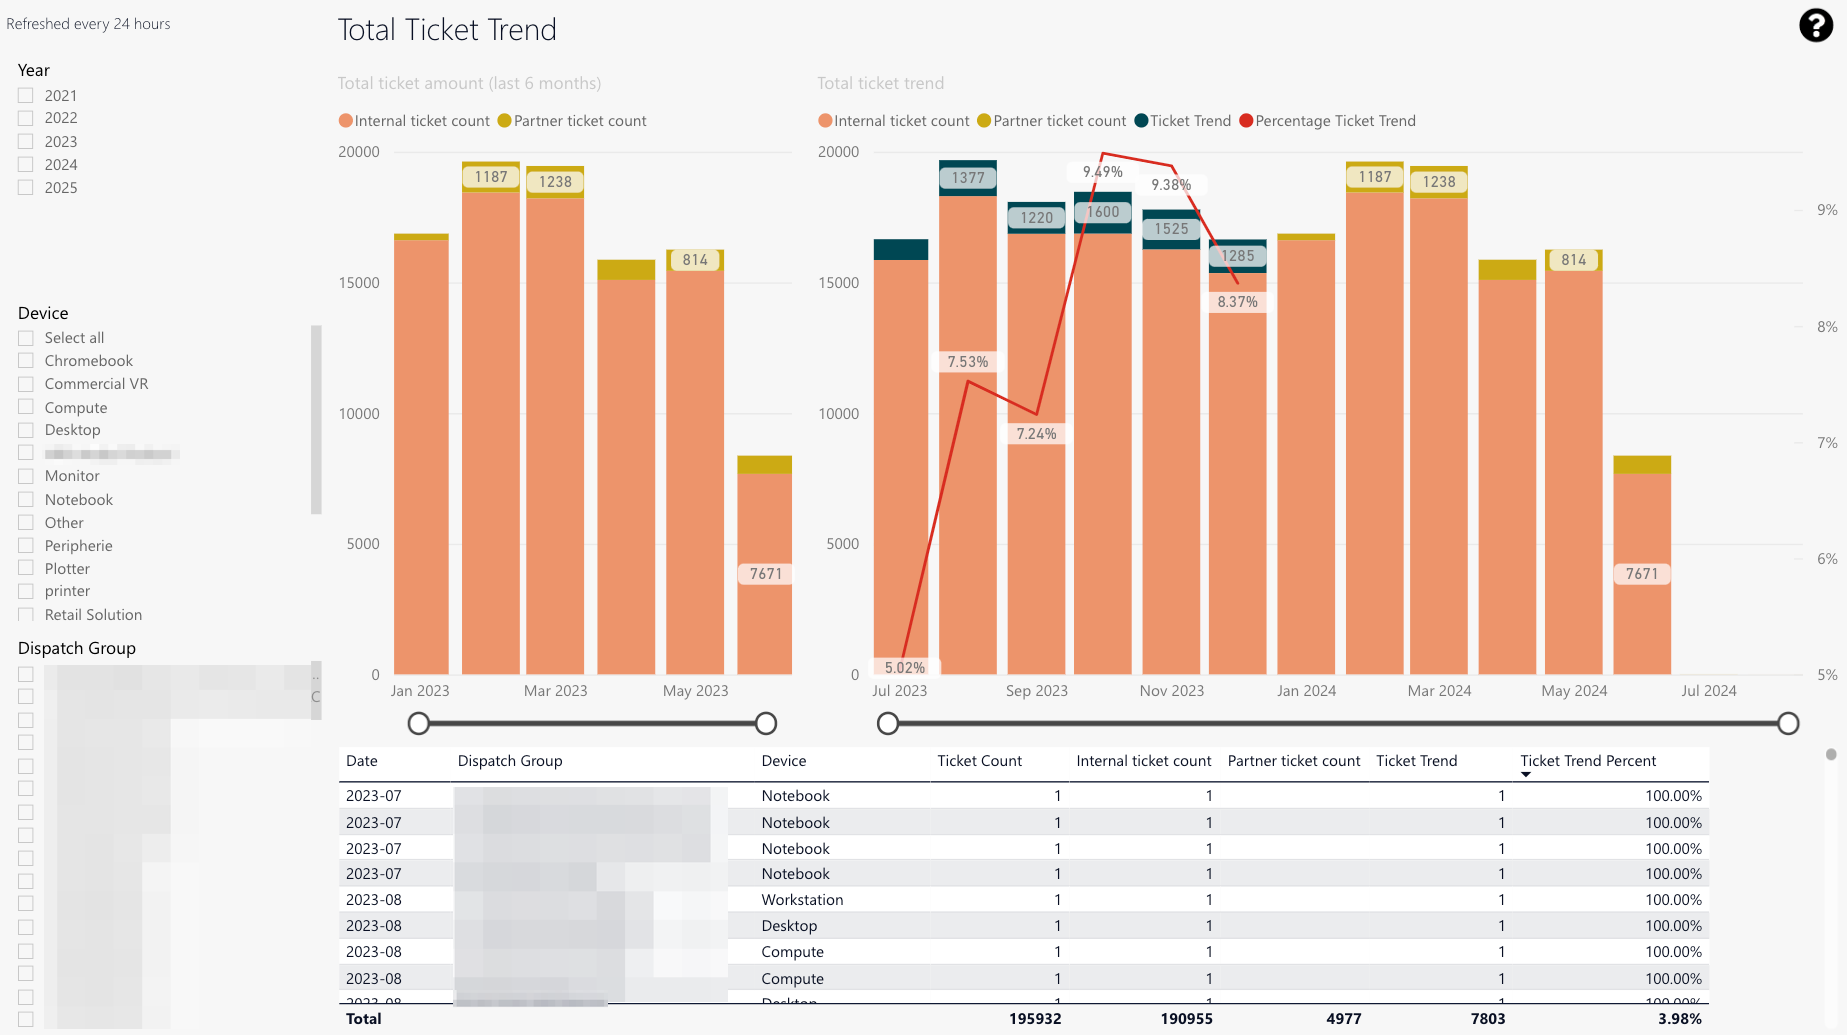
The last 6 months’ ticket count.
-
The total ticket trend in general (in percent).
-
The last years ticket count compared to the total.
-
The ticket count for particular dispatch groups, the ticket trend, and the total ticket trend in percent separated in detail by device and group in a number view.
-
Year splicer
-
Device splicer
-
Dispatch group splicer
-
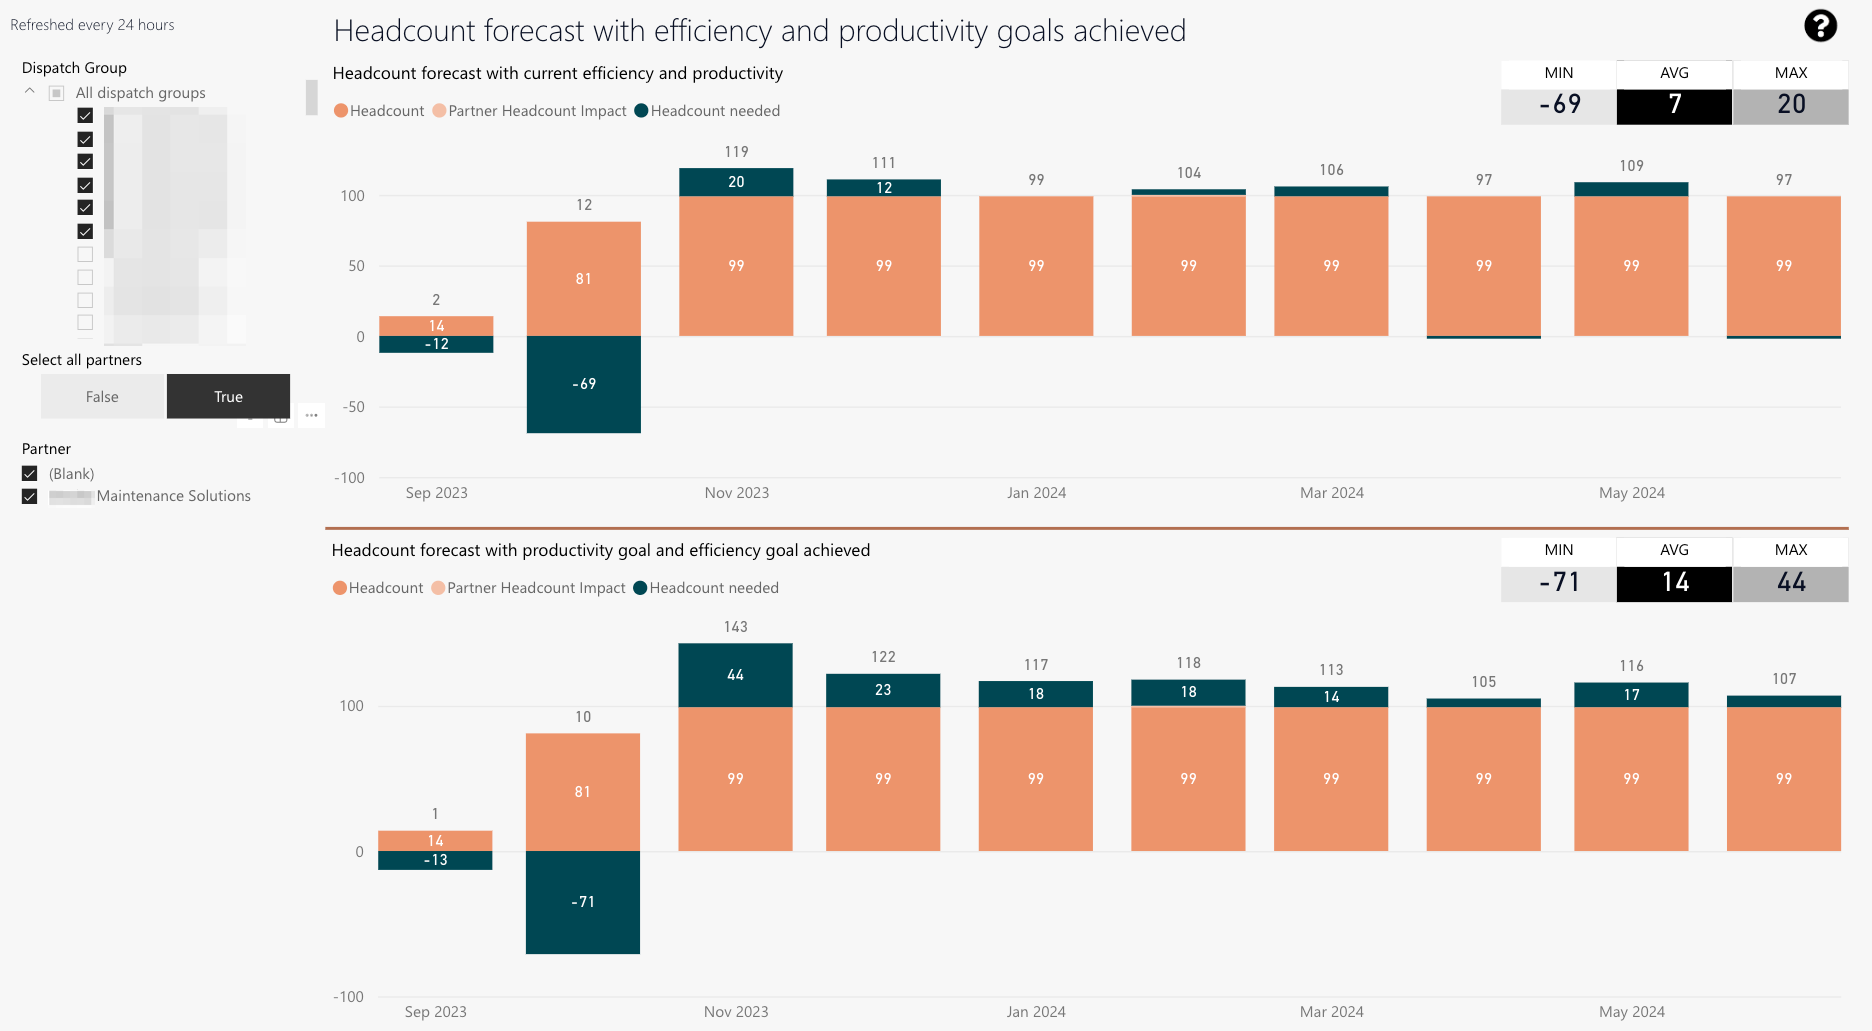
Headcount estimation based on current engineer counts while achieving current efficiency and productivity goals.
The partner headcount impact is also displayed. -
MIN: Minimum required engineers for the next 12 months to continue to maintain current productivity and efficiency.
AVG: On average required engineers for the next 12 months to continue to maintain current productivity and efficiency.
MAX: Maximum engineers for the next 12 months to continue to maintain current productivity and efficiency. -
Dispatch group splicer
-
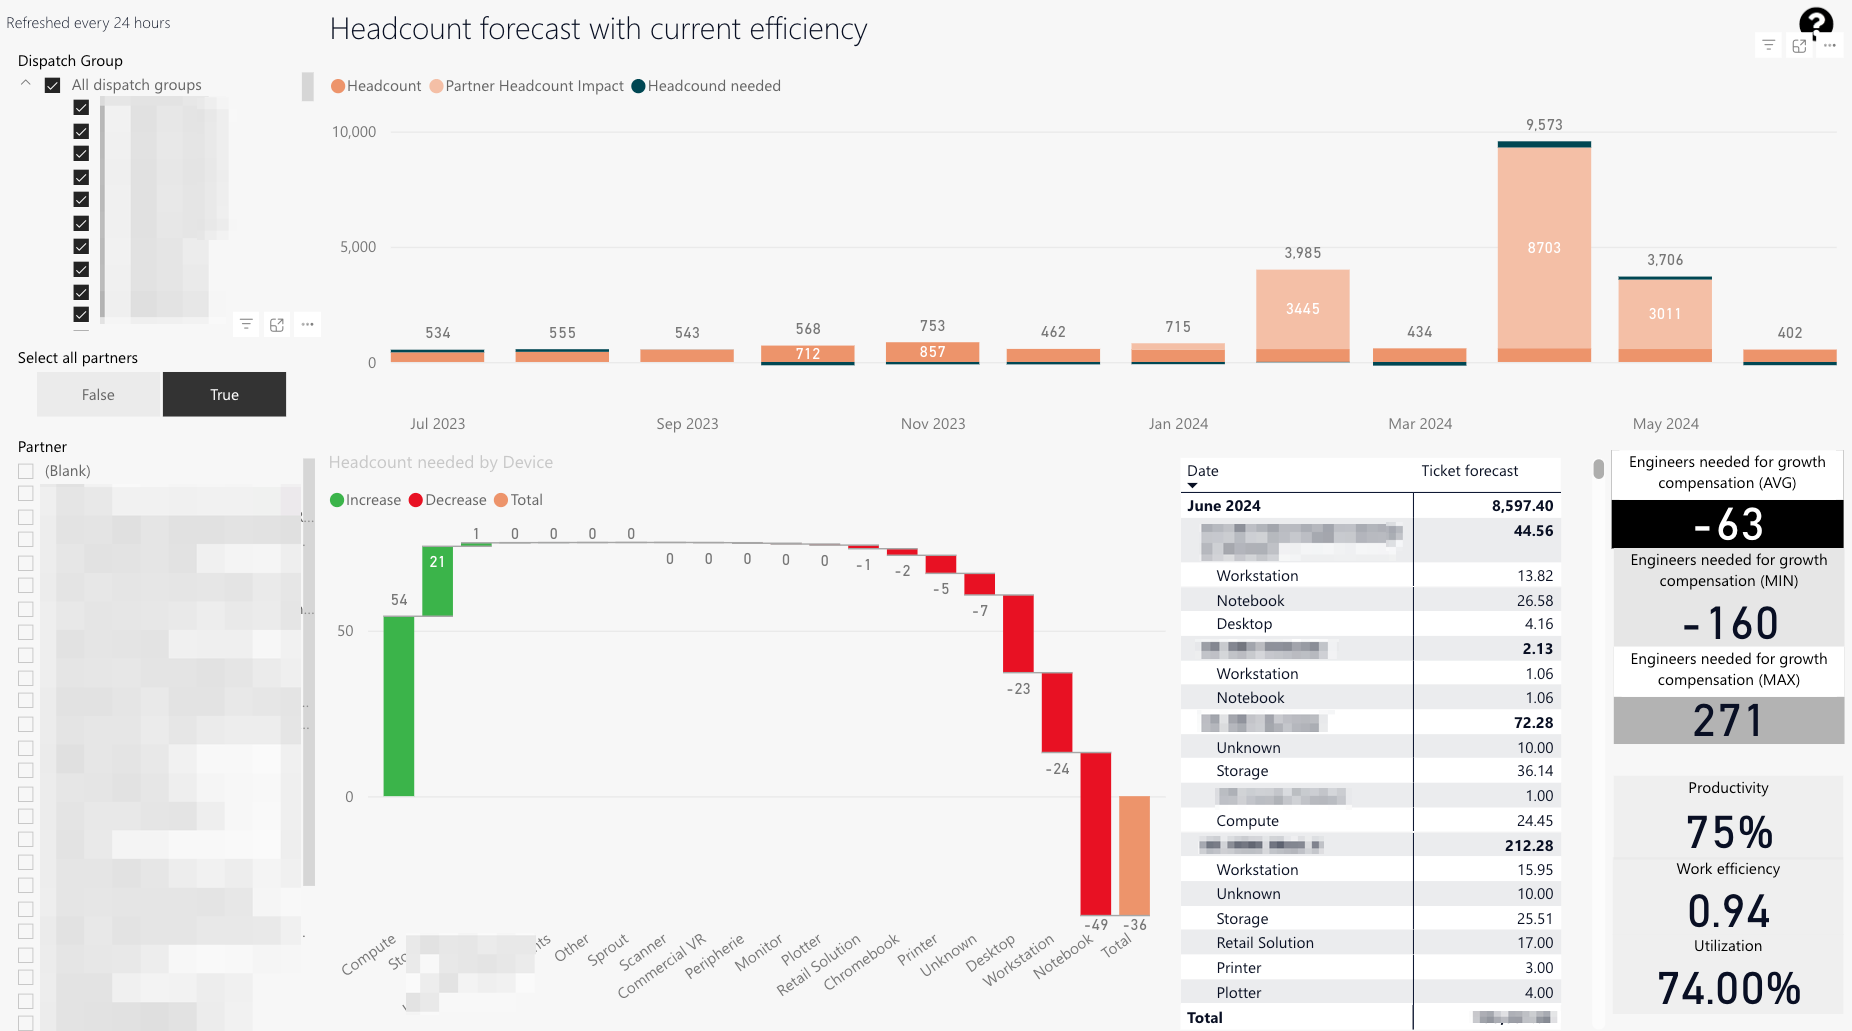
The Select all partners toggle lets you select all partners for matching selected dispatch groups (context-based).
-
Partner splicer
-
Headcount estimation based on current engineer count while achieving current efficiency and productivity goals.
The partner headcount impact is also displayed. -
Headcount required per device.
-
Ticket forecast per group and device.
-
MIN: Minimum required engineers for the next 12 months to continue to maintain current productivity and efficiency.
AVG: On average required engineers for the next 12 months to continue to maintain current productivity and efficiency.
MAX: Maximum engineers for the next 12 months to continue to maintain current productivity and efficiency. -
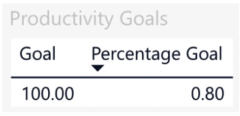
Current productivity
Work efficiency
Utilization -
Dispatch group splicer
-
The Select all partners toggle lets you select all partners for matching selected dispatch groups (context-based).
-
Partner splicer