Fieldcode Manual

Tip: You can use filters for better results

The Timeline shows the engineers of one or more dispatch groups and their appointments, hour by hour. Dispatchers use it to see who works on which ticket and when, and to assign, schedule, and publish tickets.

The Timeline is a component of the Work Place. It appears when your current view includes it, as described in Views Explained.

This page explains what the Timeline shows and how to change what you see. Tasks such as optimizing, publishing, and locking tickets have their own articles, linked from the sections below.

Header

The Timeline header with the Dispatch group list, Show me box, date and time, Navigate and Zoom level buttons, the Planning and Live switch, and the settings button.
The Timeline header
  • Dispatch group – Selects the dispatch groups the Timeline shows. See Dispatch groups.

  • Show me – Highlights a ticket or an engineer. See Show me.

  • Date & Time – The day and time the Timeline starts at, with arrows for the previous and next day and a calendar button. See Date, navigation, and zoom.

  • Navigate – Moves the Timeline exactly 24 hours earlier or later.

  • Zoom level – Shows more or less time, up to 48 hours.

  • Planning and Live – Switch between the planned schedule and what is happening in the field. See Planning and Live views.

  • Settings button – Chooses which engineer and ticket data the Timeline shows. See Timeline settings.
Dispatch group area

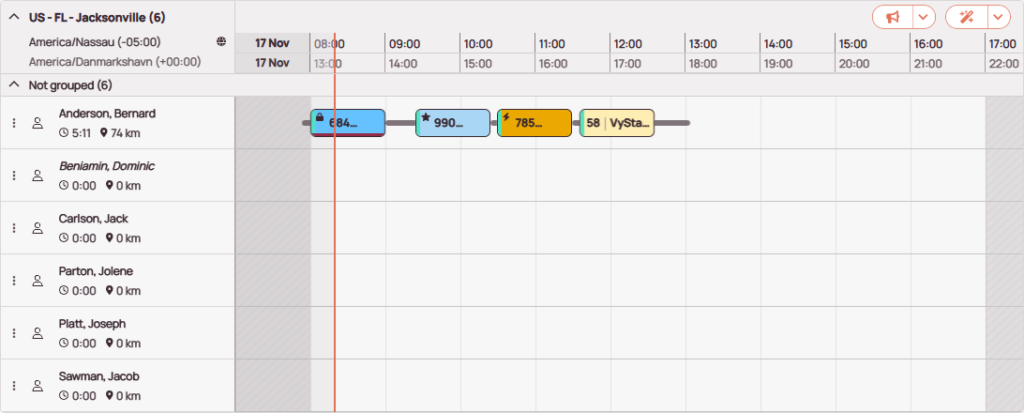
A dispatch group on the Timeline with two time zones, a subgroup, six engineers, and one engineer's tickets joined by driving lines.
A dispatch group on the Timeline
  • Dispatch group row – The group’s name and its number of engineers. The arrow collapses and expands the group.

  • Time zones – The group’s time zone, with the globe button that adds a second time zone. A second time zone gets its own row of times below the first. See Additional time zone.

  • Date and hours – The date and the hours shown, one row for each time zone. Change them with Date & Time and Zoom level.

  • Publish and Optimizer – The loudspeaker button opens the Publish window for the group, and the magic wand button opens the Optimizer window. See Publish Tickets and Optimizer Usage.

  • Subgroup – Engineers sorted into a subgroup. Engineers in no subgroup appear under Not grouped. See Dispatch groups.

  • Engineer – The engineer’s name, work time, and driving distance. A name in italics belongs to an account partner’s engineer. The menu button (three dots) opens the engineer context menu. See Engineer rows.

  • Now line – The orange vertical line marks the current time. A ticket it has passed should be in progress or reported.

  • Ticket – An appointment, labeled with the ticket data chosen in Timeline settings. Its color shows the ticket’s state, and icons such as a lock, a star, or a lightning bolt mark special conditions. See Ticket colors.

  • Driving line – The driving time between two tickets. Point to it for details.

  • Hatched area – Time outside the engineers’ working hours. See Engineer rows.
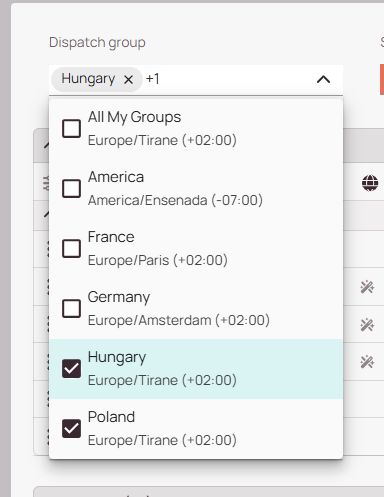
The Dispatch group list selects the dispatch groups the Timeline shows. Select one group or several. Each group appears with its engineers, separated from the next group, and shows its time zone next to its name. The time zone is set in Dispatch Groups Settings.

Inside a group, engineers can be sorted into subgroups to keep the Timeline tidy. Engineers in no subgroup appear under Not grouped. Subgroups change only how the Timeline is organized, as described in Manage Subgroups.

The Dispatch group list open, with Hungary and Poland selected and each group's time zone under its name.
Selecting dispatch groups for the Timeline

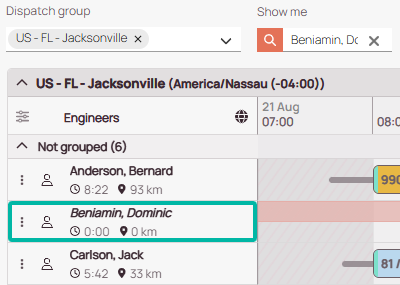
In Show me, type the Call Number Internal (CNI), the internal ticket number, of a ticket on the Timeline, or the name of an engineer in a selected dispatch group. The Timeline marks the matching ticket or engineer in green, so you can find it among many rows. Click the X in the box to clear it.

The Show me box with an engineer's name typed in, and that engineer's row outlined in green.
Finding an engineer with Show me

Date & Time sets the day and time the Timeline starts at:

  • the arrows beside the date move one day earlier or later
  • the calendar button returns to the current day and time
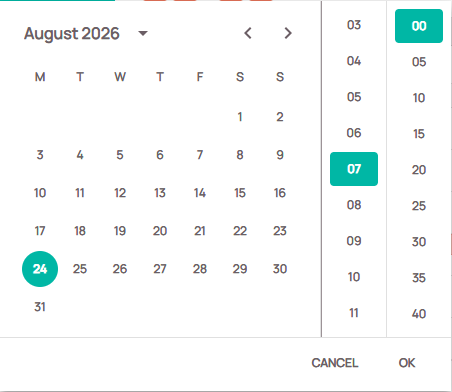
  • clicking the date opens a picker, where you select a day, an hour, and a minute and click OK

In the picker, click the month and year, or the arrow next to them, to select another year. The left and right arrows change the month.

Navigate moves the Timeline exactly 24 hours earlier or later. Zoom level shows more or less time, up to 48 hours.

The date picker for August 2026 with the 24th selected, and columns for the hour and minute.
Picking a date and time

Click Planning or Live in the upper-right corner of the Timeline to switch views.

The Planning view shows each appointment at its planned (dispatched) start and end time.

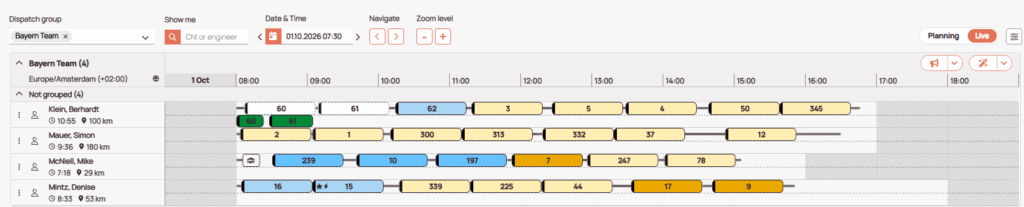
The Live view splits each engineer’s row in two: the plan on top and what is happening in the field below. Appointments that are in progress or completed show their actual times. Appointments that have not started show their planned times.

The Timeline in the Live view, with each engineer's row split into planned appointments above and actual appointments below.
The Live view, with the plan above the actual times

Timeline settings choose which engineer data appears on each engineer’s row and which ticket data appears on each ticket.

How to choose what the Timeline shows

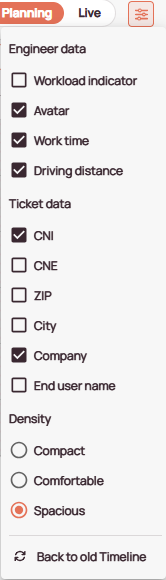
  1. Click the settings button in the upper-right corner of the Timeline.
  2. Under Engineer data and Ticket data, select the items to show and clear the items to hide.

The Timeline updates right away.

The Timeline settings, with checkboxes for engineer data and ticket data.
Timeline settings

Engineer data

  • Workload indicator – A pie chart to the left of the engineer that shows how busy they are.
  • Avatar – The engineer’s picture, set in User Settings.
  • Work time – The engineer’s planned work time. It changes as tickets are added or moved.
  • Driving distance – The engineer’s planned driving distance. It changes as tickets are added or moved.

Ticket data

  • CNI – The Call Number Internal, Fieldcode’s ticket number.
  • CNE – The Call Number External, the number from the customer’s system.
  • ZIP – The postal code of the service address.
  • City – The city of the service address.
  • Company – The customer’s company name.
  • End user name – The name of the end user.

With all ticket data selected, a ticket reads like this:

A ticket labeled 1059 / 32202 / Jacksonville / Jacksonville Sheriff's Office - HQ / Tyrone Waters.
A ticket with all ticket data shown

The Timeline shows each dispatch group in its own time zone. If you work with engineers or customers in another time zone, you can show a second time zone on the Timeline as well, so you know which time to give when you call them.

How to add an additional time zone

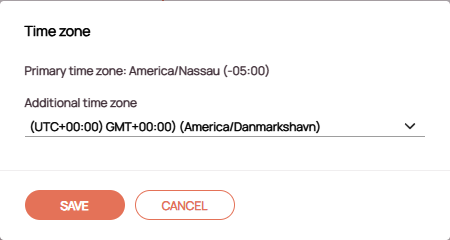
  1. Click the globe button next to the group’s time zone, below the group’s name.
  2. In the Time zone window, select a time zone under Additional time zone.
  3. Click Save.

The second time zone appears as its own row of times, below the group’s own.

The Time zone window showing the group's primary time zone and a second time zone selected under Additional time zone, with Save and Cancel buttons.
Adding an additional time zone

How to remove an additional time zone

  1. Click the globe button next to the group’s time zone.
  2. Point to the time zone under Additional time zone and click the X (Clear).
  3. Click Save without selecting another time zone.

Each engineer has a row with their appointments. On the left, the row shows:

  • the menu button (three dots), which opens the engineer context menu
  • the engineer’s avatar, or a person icon if there is none
  • the engineer’s name, in italics if the engineer works for an account partner
  • the planned work time (clock icon) and driving distance (pin icon)
  • the workload indicator, a pie chart of how busy the engineer is, if it is turned on in Timeline settings

An absence appears as a light red bar across the engineer’s row, labeled with its start and end. On-call duty appears as a bar with a red outline and a phone icon, labeled “On-call” with its start and end. Both are added with Manage Availabilities.

Hatched gray areas are outside the engineer’s working hours. On-call duty marks time outside working hours when the engineer can still take work. The Optimizer and the Scheduling Assistant ignore on-call duty, so tickets can only be placed there by drag and drop.

An engineer's row covered by a light red bar labeled Absence, with the start and end date and time.
An absence on an engineer's row

Engineer summary

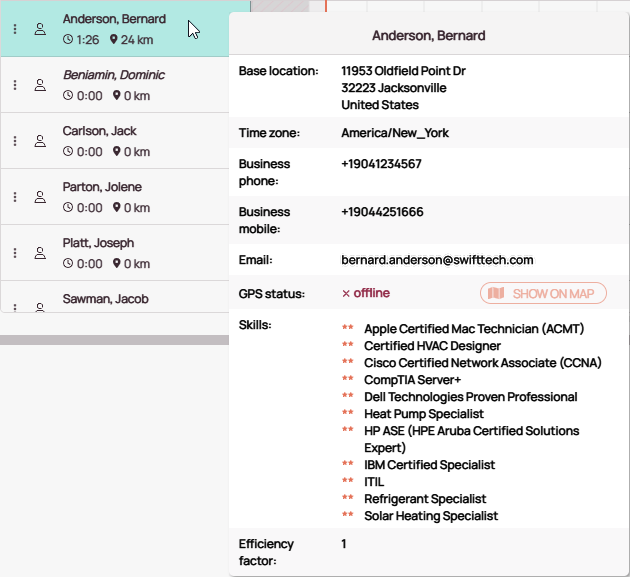
Point to an engineer’s name to see their summary: base location, time zone, business phone and mobile, email, GPS status, skills, and efficiency factor. Next to the GPS status is a Show on Map button, which is unavailable while the GPS status is offline. If the engineer uses a temporary location, the summary shows its start and end locations as well.

The engineer summary

Click the menu button (three dots) to the left of an engineer’s name, or right-click the name, to open the engineer context menu:

  • Optimize Engineer – Runs the Optimizer for this engineer only. See Optimize Engineer.
  • Optimize Engineer’s Timeline – Reorders the unlocked, unpublished tickets already assigned to this engineer. See Optimize Engineer’s Timeline.
  • Show on Map – Moves the Map to the engineer.
  • Manage Availabilities – Adds absences and on-call duty. See Manage Availabilities.
  • Manage Subgroups – Adds the engineer to a subgroup or removes them from one. See Manage Subgroups.
  • Edit User (Admin Panel) – Opens the engineer’s user settings in the Admin Panel, in a new browser tab. Only users whose permission set includes the Users page of the Admin Panel see this item. See User Settings.

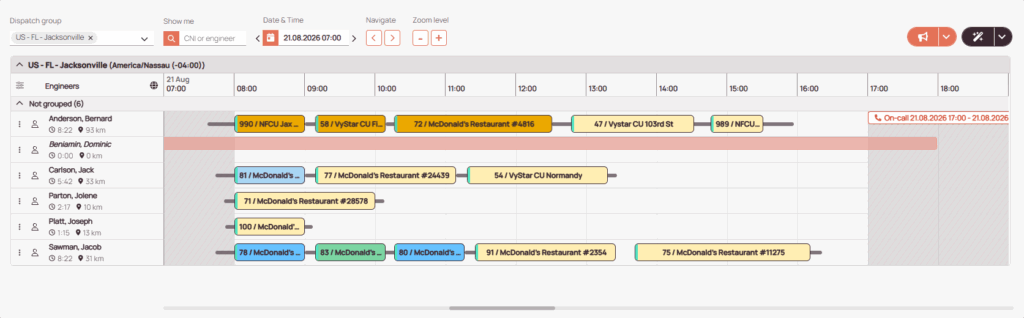
Each appointment is a box on the engineer’s row, from its start to its end time. Its color shows the ticket’s state, such as whether it has reached the engineer’s FMA, as described in Ticket colors, which also explains the icons on a ticket. The text on a ticket is chosen in Timeline settings.

A gray line between two tickets is the driving time from one to the next. The orange vertical line, the now line, marks the current time.

The Timeline for a Jacksonville dispatch group, with colored tickets and gray driving lines on six engineer rows, an absence, and an on-call bar.
Tickets, driving times, an absence, and on-call duty on the Timeline

Ticket summary

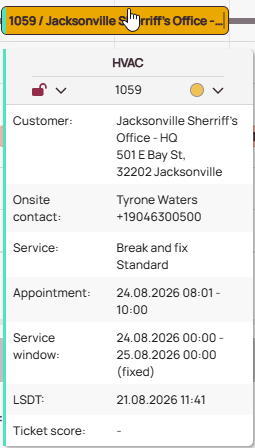
Point to a ticket to see its summary: the customer and address, the onsite contact, the service, the appointment and service window, the Latest Service Delivery Time (LSDT), and the ticket score.

The summary of a ticket for the Jacksonville Sheriff's Office, with the onsite contact, service, appointment, service window, and LSDT.
The ticket summary

Driving summary

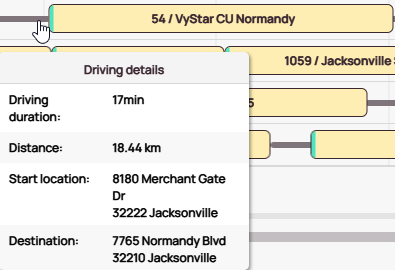
Point to the gray line before or after a ticket to see the driving duration, the distance, and the start and end locations.

The driving details between two tickets: duration, distance, start location, and destination.
The driving summary

PUDO appointments

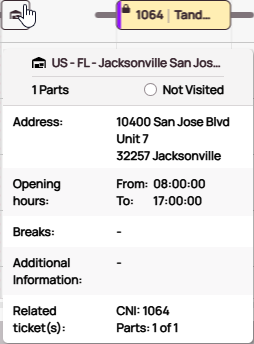
A pick-up and drop-off (PUDO) appointment is a visit to a PUDO location to collect or return spare parts. Point to it to see the PUDO location, the number of parts, the visit status, and the address. To move a PUDO appointment, see Reschedule PUDOs.

The summary of a PUDO appointment, with the location name, number of parts, visit status, and address.
The PUDO summary

Ticket context menu

Right-click a ticket to open its context menu:

A ticket’s color shows its dispatch status: how far the appointment has come, from assignment to completion. Dispatch statuses are not the same as the ticket’s workflow status, which is described in Ticket Statuses.

The table lists the dispatch statuses in the order a ticket goes through them.

ColorStatusMeaning
A pale yellow ticket on the Timeline, the color of an assigned ticket.
Pale yellow
AssignedThe ticket is assigned to an engineer, but the appointment is not scheduled yet.
A yellow ticket on the Timeline, the color of a proposed appointment.
Yellow
ProposedThe appointment has a proposed time, which the end user has not confirmed yet. See Fixed and proposed appointments in Scheduling Assistant Explained.
An amber ticket on the Timeline, the color of a scheduled ticket.
Amber
ScheduledThe appointment is scheduled. The engineer does not see it yet.
A pale blue ticket on the Timeline, the color of a published ticket.
Pale blue
PublishedThe appointment is waiting to synchronize with the engineer's FMA.
A sky blue ticket on the Timeline, the color of a synchronized ticket.
Sky blue
SynchronizedThe appointment is in the engineer's FMA, ready for service.
A pale green ticket on the Timeline, the color of a ticket whose engineer is on the way.
Pale green
On the WayThe engineer is driving to the location.
A medium green ticket on the Timeline, the color of a ticket whose engineer is onsite.
Medium green
OnsiteThe engineer has arrived at the location, or is working on the appointment. Both look the same.
A dark green ticket on the Timeline, the color of a reported ticket.
Dark green
ReportedThe engineer has reported the appointment.
A light red ticket on the Timeline, the color of a ticket with an error.
Light red
ErrorA data or technical problem. Check the ticket in Ticket Details, or contact Fieldcode Support.
A white ticket with a dashed outline, how a started or reported appointment looks in the plan row of the Live view.
White, dashed outline
Started (Live view)In the Live view, the plan row shows an appointment like this once the engineer has started it, and it stays like this after the appointment is reported. The row below shows its actual times, in the color of its current status.

Ticket indicators

Icons and lines on a ticket add information to its color:

  • Lock – The ticket is locked, so the Optimizer does not move it. See Lock/Unlock Tickets.
  • Star – The ticket has VIP status, such as for an important customer.
  • Lightning bolt – The ticket is escalated and may need urgent attention.
  • Exclamation mark – The ticket overlaps another ticket in the same time slot.
  • Colored stripe on the left – The color of the ticket’s project.
  • Yellow line along the bottom – A possible delay: the engineer has not reported that they are on the way, although it is past the time they should have started driving.
  • Red line along the bottom – The engineer has not started the ticket, although the now line shows it should be in progress.
Was this topic helpful?
5 out of 5 stars

1 rating

5 Stars 100%
4 Stars 0%
3 Stars 0%
2 Stars 0%
1 Stars 0%
5
How can we further improve this topic?
Please provide the reason for your vote. This will help us improve this topic.
Navigation